Salinity Experiment Reporting Template
advertisement
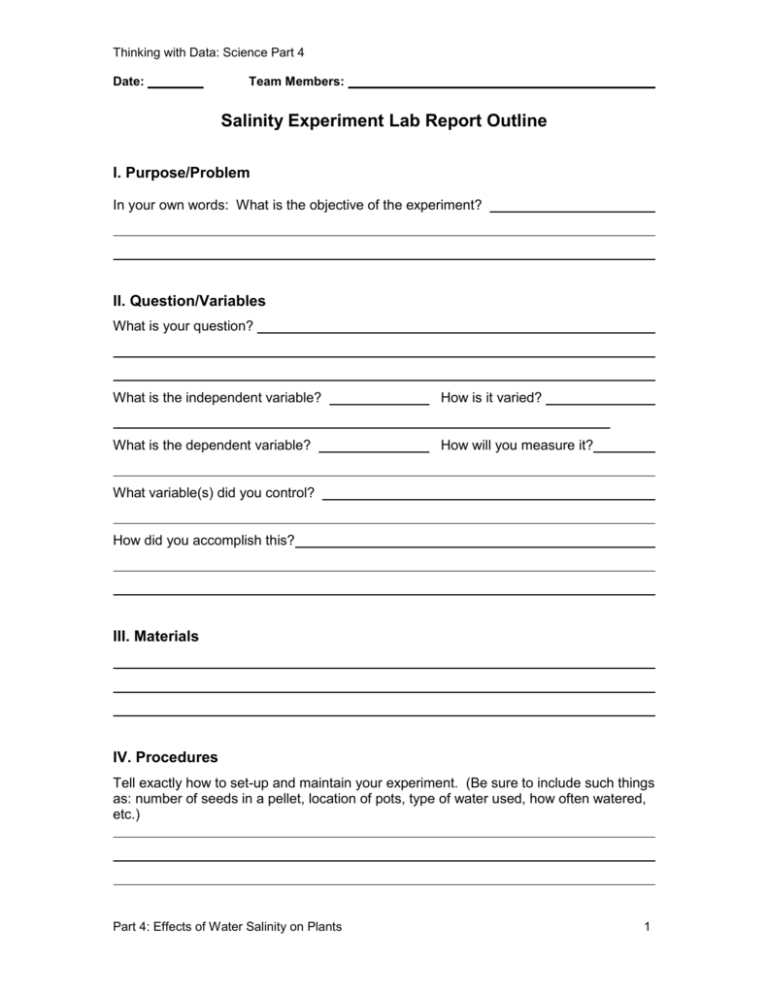
Thinking with Data: Science Part 4 Date: Team Members: Salinity Experiment Lab Report Outline I. Purpose/Problem In your own words: What is the objective of the experiment? II. Question/Variables What is your question? What is the independent variable? How is it varied? What is the dependent variable? How will you measure it? What variable(s) did you control? How did you accomplish this? III. Materials IV. Procedures Tell exactly how to set-up and maintain your experiment. (Be sure to include such things as: number of seeds in a pellet, location of pots, type of water used, how often watered, etc.) Part 4: Effects of Water Salinity on Plants 1 Thinking with Data: Science Part 4 V. Data Collect data on Experiment document. Enter in to Salinity Experiment Reporting Spreadsheet. VI. Analysis (Graph) Create 3 visual representations (graphs) of your collected data. Use Excel to create graphs for the number of sprouts and the total height. For your third, unique measurement, create a visual representation on chart paper. VII. Conclusions Describe any parts of the data that supported your hypothesis and did not support your hypothesis. Explain how salinity effected plant growth using evidence from your experiment. Part 4: Effects of Water Salinity on Plants 2


