Economic_elnino - Atmospheric and Oceanic Science
advertisement
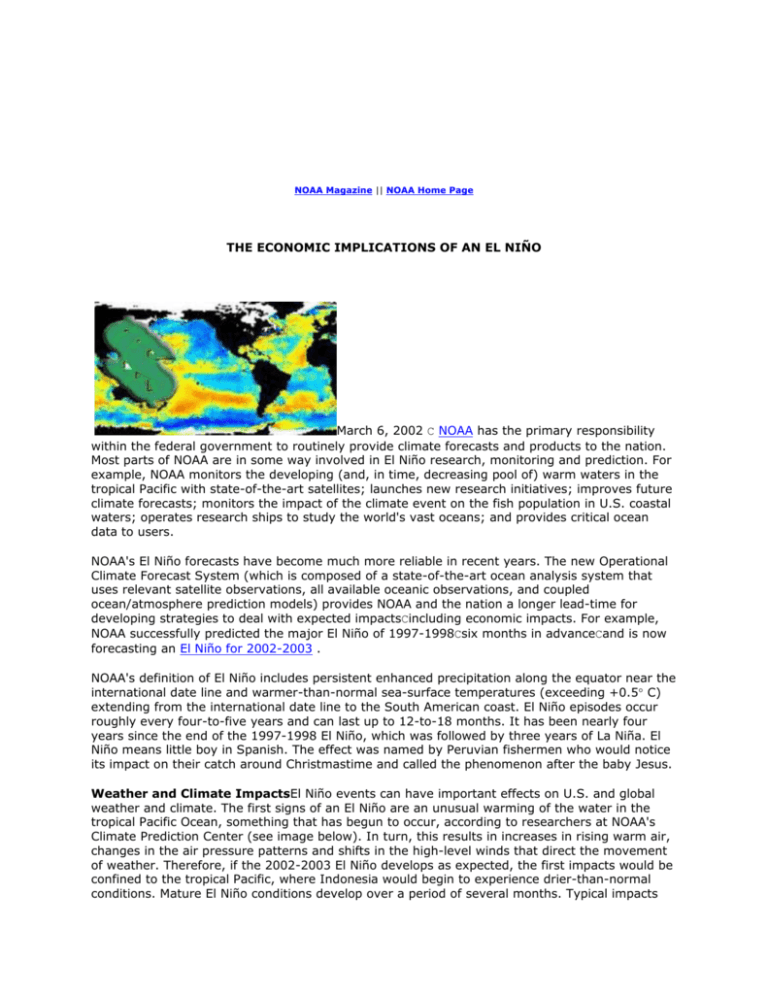
NOAA Magazine || NOAA Home Page THE ECONOMIC IMPLICATIONS OF AN EL NIÑO March 6, 2002 C NOAA has the primary responsibility within the federal government to routinely provide climate forecasts and products to the nation. Most parts of NOAA are in some way involved in El Niño research, monitoring and prediction. For example, NOAA monitors the developing (and, in time, decreasing pool of) warm waters in the tropical Pacific with state-of-the-art satellites; launches new research initiatives; improves future climate forecasts; monitors the impact of the climate event on the fish population in U.S. coastal waters; operates research ships to study the world's vast oceans; and provides critical ocean data to users. NOAA's El Niño forecasts have become much more reliable in recent years. The new Operational Climate Forecast System (which is composed of a state-of-the-art ocean analysis system that uses relevant satellite observations, all available oceanic observations, and coupled ocean/atmosphere prediction models) provides NOAA and the nation a longer lead-time for developing strategies to deal with expected impactsCincluding economic impacts. For example, NOAA successfully predicted the major El Niño of 1997-1998Csix months in advanceCand is now forecasting an El Niño for 2002-2003 . NOAA's definition of El Niño includes persistent enhanced precipitation along the equator near the international date line and warmer-than-normal sea-surface temperatures (exceeding +0.5 C) extending from the international date line to the South American coast. El Niño episodes occur roughly every four-to-five years and can last up to 12-to-18 months. It has been nearly four years since the end of the 1997-1998 El Niño, which was followed by three years of La Niña. El Niño means little boy in Spanish. The effect was named by Peruvian fishermen who would notice its impact on their catch around Christmastime and called the phenomenon after the baby Jesus. Weather and Climate ImpactsEl Niño events can have important effects on U.S. and global weather and climate. The first signs of an El Niño are an unusual warming of the water in the tropical Pacific Ocean, something that has begun to occur, according to researchers at NOAA's Climate Prediction Center (see image below). In turn, this results in increases in rising warm air, changes in the air pressure patterns and shifts in the high-level winds that direct the movement of weather. Therefore, if the 2002-2003 El Niño develops as expected, the first impacts would be confined to the tropical Pacific, where Indonesia would begin to experience drier-than-normal conditions. Mature El Niño conditions develop over a period of several months. Typical impacts on the United States Atlantic basin include the following: and the ! Hurricanes: Below normal number of tropical storms/hurricanes in the Atlantic, although this does not imply any limits on the strength or location of any given tropical system. ! Monsoons: A drier-than-normal North American Monsoon, especially for Mexico, Arizona and New Mexico. ! Drought: A drier-than-normal fall and winter in the U.S. Pacific Northwest. ! Wintertime Storms: A wetter-than-normal winter in the Gulf Coast states from Louisiana to Florida, and in central and southern California if El Niño is strong. ! Warmer Temperatures: A warmer than normal late fall and winter in the northern Great Plains and upper Midwest. Implications of El Niño for the Nation's Economy Weather and climate sensitive industries directlyimpacted by weather (such as agriculture, construction, energy distribution, and outdoor recreation) account for nearly 10 percent of GDP. Further, weather and climate indirectly impacts an even larger portion of the nation's economy, extending to parts of finance and insurance, services, retail and wholesale trade, as well as manufacturing. Some analysts estimate that nearly 25 percent of GDP, or $2.7 trillion, is either directly or indirectly impacted by weather and climate. El Niño impacts important business variables like sales, revenues, and employment in a wide range of climate-sensitive industries and sectors. Overall, total U.S. economic impacts of the 1997-1998 El Niño were estimated to be on the order of $25 billion. ! These economic impacts lead to both gains and losses among regions and within industries. For example, department store sales were up by five to 15 percent during the abnormally warm winter in the Midwest, but sales of snow equipment like snowmobiles were down by nearly 35 percent. Skiing was up in the West but down in the Midwest. In the highly weather sensitive energy sector, households and businesses saved $2-7 billion in heating costs, while energy production and distribution businesses suffered from reduced sales. ! In fact, on balance, the effect of the 1997-98 El Niño in the U.S. could well have been an economic benefit, with gains and losses across regions and industries. While economic impacts tend to cancel each other out at the national level, El Niño does cause real economic lossessuch as storm damage or crop losses, which are not offset by gains elsewhere. These are losses that can't be prevented or reduced by a better forecast or mitigation. For example, on average, El Niños result in agricultural losses approaching $2 billion, or nearly 1-2 percent of total crop output. In the 1997-98 El Niño, property losses were estimated at nearly $2.6 billion. Fortunately, these real losses are generally a small fraction of the economic impacts of El Niño. The Economic Benefits of Better El Niño Forecasts-Improving Economic Decisions Although all losses cannot be avoided, NOAA's El Niño forecasts produce economic value by allowing individuals, industries, and public officials to take timely actions based on the forecast to mitigate and reduce losses or to capitalize on the information to improve economic outcomes. For example: ! In California, prior to the 1997-1998 El Niño, this state's emergency management agencies and FEMA spent an estimated $165 million preparing for storms and heavy rain. Actual storm losses in the 1997-1998 El Niño were $1.1 billion, compared to $2.2 billion in the large 1982-1983 El Niño. Although portions of the $1.1 billion difference are due to different intensities and durations of storminess during each El Niño, a significant portion of the savings came from heightened preparedness. ! Within agriculture, crop planting decisions, seed selection, fertilizer application, etc., can be adjusted to reduce vulnerability to abnormal weather conditions, making both producers and consumers better off. It also may be possible to adjust storage of crop inventories in anticipation of changed yields due to El Niño. ! In water management, for hydroelectric power production and competing water uses, storage and release decisions can be altered from normal use patterns in anticipation of above normal rains in the coming winter-spring seasons. For instance, winter stream flows in El Niño years into the Tennessee Valley Authorities' large reservoirs can be as much as 30 percent above normal, allowing efficiency gains by switching from thermal and hydro power. ! In natural gas and heating oil production and distribution,normal patterns of crude oil refining, inventories, and distribution may be adjusted to reduce losses to producers and sellers when warmer winter weather conditions are anticipated. ! In some fisheries, management practices can be changed to partially offset the negative effects of El Niño on recruitment. ! Property owners can accelerate plans to repair or improve structures to make them less vulnerable to winter storms. In California, an estimated $125 million was spent on home and business improvements and repairs to mitigate the anticipated effects of El Niño storms. Measuring the Economic Benefits of El Niño Forecasts Economists have quantified the benefits of improved El Niño forecasts in various sectors: ! Benefits to U.S. agriculture by altering planting decisions have been estimated at $265-300 million annually, throughout El Niño, normal, and La Niña years. Similarly, benefits to Mexican agriculture range from $10 to $25 million annually. ! Benefits in U.S. corn storage from optimizing inventory storage costs could approach $200 million annually. ! Even in the small Northwest Coho salmon fishery, annual benefits are estimated at $250,000 to $1 million from changing hatchery releases and harvest rates. ! Further, better forecasts reduce uncertainty and improve new insurance systems like the $7+ billion weather derivatives market by improving price risk projection. Summary We still have many uncertainties in our understanding and forecasting of El Niño Southern Oscillation (ENSO). For instance, we need to better understand and model how ENSO events are unique and how they interact with other climate and weather patterns, often leading to diverse regional and local economic impacts. Those issues not withstanding, cost benefits studies have shown investments in El Niño forecasting to be a sound use of taxpayer dollars. Comparing forecast systems costs with anticipated benefits in just the U.S. agriculture sector yielded an estimated annual rate of return on that investment of between 13 to 26 percent. For additional reading on the impacts of El Niño, see El Niño 1997-98-The Climate Event of the Century, edited by Stan Changdon, Oxford Press, 2000. For additional reading on the economics of El Niño, see Improving El Niño Forecasting: The Potential Economic Benefits, edited by Rodney Weiher, NOAA, 2000, available at rodney.f.weiher@noaa.gov . Fast Facts Chronology of events in the history of understanding El Niño and La Niña Relevant Web Sites NOAA's Current Sea Surface Temperature Maps EL NIÑO/SOUTHERN OSCILLATION (ENSO) DIAGNOSTIC DISCUSSION EL NIÑO AND LA NIÑA-RELATED WINTER FEATURES OVER NORTH AMERICA Seasonal Mean Temperatures and Precipitation for the United States during Strong El Niños NOAA's El Niño Theme Page NOAA's El Niño Home Page CLIMATE FACTORS HELPING TO SHAPE WINTER 2001-2002 ENSO Fact Sheet ENSO Frequently Asked Questions ENSO Tutorial ENSO Recent Events Sea Surface Temperature Outlook Media Contact: Greg Hernandez , NOAA , (202) 482-3091
