estimation of conditional expectations and conditional
advertisement
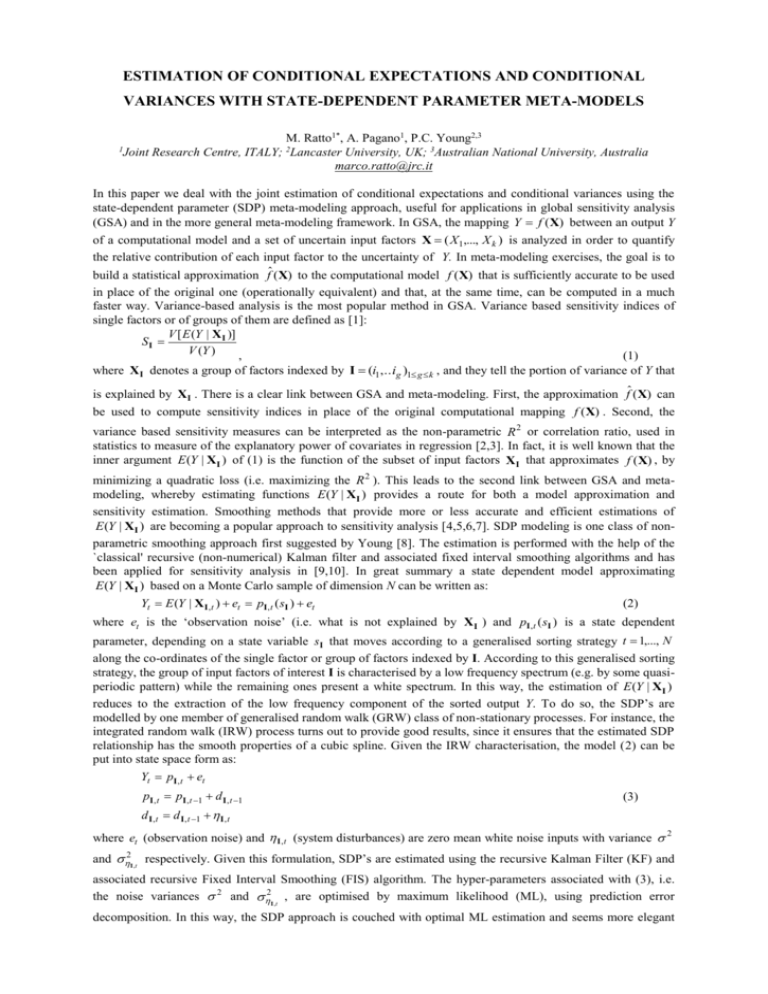
ESTIMATION OF CONDITIONAL EXPECTATIONS AND CONDITIONAL VARIANCES WITH STATE-DEPENDENT PARAMETER META-MODELS 1 M. Ratto1*, A. Pagano1, P.C. Young2,3 Joint Research Centre, ITALY; 2Lancaster University, UK; 3Australian National University, Australia marco.ratto@jrc.it In this paper we deal with the joint estimation of conditional expectations and conditional variances using the state-dependent parameter (SDP) meta-modeling approach, useful for applications in global sensitivity analysis (GSA) and in the more general meta-modeling framework. In GSA, the mapping Y f (X) between an output Y of a computational model and a set of uncertain input factors X ( X1,..., X k ) is analyzed in order to quantify the relative contribution of each input factor to the uncertainty of Y. In meta-modeling exercises, the goal is to build a statistical approximation fˆ (X) to the computational model f (X) that is sufficiently accurate to be used in place of the original one (operationally equivalent) and that, at the same time, can be computed in a much faster way. Variance-based analysis is the most popular method in GSA. Variance based sensitivity indices of single factors or of groups of them are defined as [1]: V [ E (Y | X I )] SI V (Y ) , (1) where X I denotes a group of factors indexed by I (i1,...ig )1 g k , and they tell the portion of variance of Y that is explained by X I . There is a clear link between GSA and meta-modeling. First, the approximation fˆ (X) can be used to compute sensitivity indices in place of the original computational mapping f (X) . Second, the variance based sensitivity measures can be interpreted as the non-parametric R 2 or correlation ratio, used in statistics to measure of the explanatory power of covariates in regression [2,3]. In fact, it is well known that the inner argument E (Y | XI ) of (1) is the function of the subset of input factors X I that approximates f (X) , by minimizing a quadratic loss (i.e. maximizing the R 2 ). This leads to the second link between GSA and metamodeling, whereby estimating functions E (Y | XI ) provides a route for both a model approximation and sensitivity estimation. Smoothing methods that provide more or less accurate and efficient estimations of E (Y | XI ) are becoming a popular approach to sensitivity analysis [4,5,6,7]. SDP modeling is one class of nonparametric smoothing approach first suggested by Young [8]. The estimation is performed with the help of the `classical' recursive (non-numerical) Kalman filter and associated fixed interval smoothing algorithms and has been applied for sensitivity analysis in [9,10]. In great summary a state dependent model approximating E (Y | XI ) based on a Monte Carlo sample of dimension N can be written as: Yt E (Y | X I , t ) et pI , t ( sI ) et (2) where et is the ‘observation noise’ (i.e. what is not explained by X I ) and pI , t ( sI ) is a state dependent parameter, depending on a state variable s I that moves according to a generalised sorting strategy t 1,..., N along the co-ordinates of the single factor or group of factors indexed by I. According to this generalised sorting strategy, the group of input factors of interest I is characterised by a low frequency spectrum (e.g. by some quasiperiodic pattern) while the remaining ones present a white spectrum. In this way, the estimation of E (Y | XI ) reduces to the extraction of the low frequency component of the sorted output Y. To do so, the SDP’s are modelled by one member of generalised random walk (GRW) class of non-stationary processes. For instance, the integrated random walk (IRW) process turns out to provide good results, since it ensures that the estimated SDP relationship has the smooth properties of a cubic spline. Given the IRW characterisation, the model (2) can be put into state space form as: Yt pI , t et pI , t pI , t 1 d I , t 1 (3) d I , t d I , t 1 I , t where et (observation noise) and I , t (system disturbances) are zero mean white noise inputs with variance 2 and 2I ,t respectively. Given this formulation, SDP’s are estimated using the recursive Kalman Filter (KF) and associated recursive Fixed Interval Smoothing (FIS) algorithm. The hyper-parameters associated with (3), i.e. the noise variances 2 and 2I ,t , are optimised by maximum likelihood (ML), using prediction error decomposition. In this way, the SDP approach is couched with optimal ML estimation and seems more elegant and flexible than the scatter plot smoothing used by Hastie, Tibshirani and others [4,5,7,11]. For example, Random Walk (RW) or Smoothed Random Walk (SRW) might be preferable in certain circumstances because they yield less smooth estimates. Indeed, if any sharp changes or jumps seem possible, then these can be handled using `variance intervention' (see [12]). In particular, all effects that cannot attributed to shifts in the mean, are not accounted for by E (Y | X i ) and the related variance-based sensitivity indices. For example, if we consider Figure 1, in panel (a) we show the estimate of E (Y | X i ) , in (b) we show that the ‘observation noise’ ei Y E (Y | X i ) has a clear heteroschedastic nature, which is not taken into account by any shift in the mean, but that can be modelled by assuming that the variance of ei is modulated by X i in some state-dependent manner. This is done by the state-dependent decomposition log(ei2,t ) mi , t ( si ) nt where now the state dependent parameter mi , t ( si ) accounts for the modulation effect, shown in panel (c). Moreover, remembering the conditional variance expression V (Y | X i ) E(Y 2 | X i ) ( E(Y | X i ))2 E((Y E(Y | X i ))2 | X i ) E(ei2 | X i ) we get the estimate V (Y | X i ) exp( mi ) E (exp( nt )) shown with the black line in panel (d), compared with the horizontal grey line showing the variance of ei , given by 2 E[V (Y | X i )] . Moreover, feeding back the estimated state-dependency of 2 with variance intervention [12] in the recursive estimation of E (Y | X i ) , one will get a much more accurate and efficient estimation of the whole pattern and in particular of the sharp change at X i 0.5 . (a) Y vs Xi (c) log(e2i ) vs Xi (b) ei vs Xi 4 2 3 1 2 0 -10 1 -1 -15 (d) V(Y|Xi) 0 0.4 -5 0.3 0 0 0.5 1 -2 0.2 0.1 -20 0 0.5 1 0 0.5 1 0 0 0.5 1 Figure 1 References [1] Sobol’ IM: Sensitivity estimates for nonlinear mathematical models. Matematicheskoe Modelirovanie 2, 112118, (1990). [2] Pearson K: On the general theory of skew correlation and non-linear regression, Drapers Company Research Memoirs, Biometrics Series 2, 3-54 (1905) [3] Doksum K, Samarov A: Nonparametric Estimation of Global Functionals and a Measure of the Explanatory Power of Covariates in Regression. The Annals of Statistics 23, 1443-1473 (1995) [4] Li G, Wang SW, Rabitz H: Practical approaches to construct RS-HDMR component functions. Journal of Physical Chemistry 106, 8721-8733 (2002) [5] Li G, Hu J, Wang S-W, Georgopoulos PG, Schoendorf J, Rabitz H: Random Sampling-High Dimensional Model Representation (RS-HDMR) and orthogonality of its different order component functions. Journal of Physical Chemistry A 110:2474-2485 (2006) [6] Oakley J, O'Hagan A: Probabilistic sensitivity analysis of complex models: a Bayesian approach. Journal of the Royal Statistical Society Series B, 66, 751-769 (2004) [7] Storlie CB, Helton JC: Multiple predictor smoothing methods for sensitivity analysis, SANDIA Report, SAND2006-4693 (2006) [8] Young PC: Time variable and state dependent modelling of nonstationary and nonlinear time series. In T. Subba Rao, editor, Developments in Time Series Analysis, 374-413. Chapman and Hall, London, (1993). [9] Ratto M, Tarantola S, Saltelli A, Young PC: Accelerated estimation of sensitivity indices using State Dependent Parameter models. In K. M. Hanson and F. M. Hemez, eds, Proc. of the 4th Intl Conf. on Sensitivity Analysis of Model Output (SAMO 2004) 61–70 (2004) [10] Ratto M, Saltelli A, Tarantola S, Young P: Improved and accelerated sensitivity analysis using State Dependent Parameter models. EUR 22251 EN, JRC report (2006) [11] Hastie TJ, Tibshirani RJ: Generalized Additive Models. Chapman and Hall, 1996. [12] Young PC, Ng CN: Variance intervention. Journal of Forecasting, 8, 399-416 (1989)

