Supplementary Information (doc 450K)
advertisement
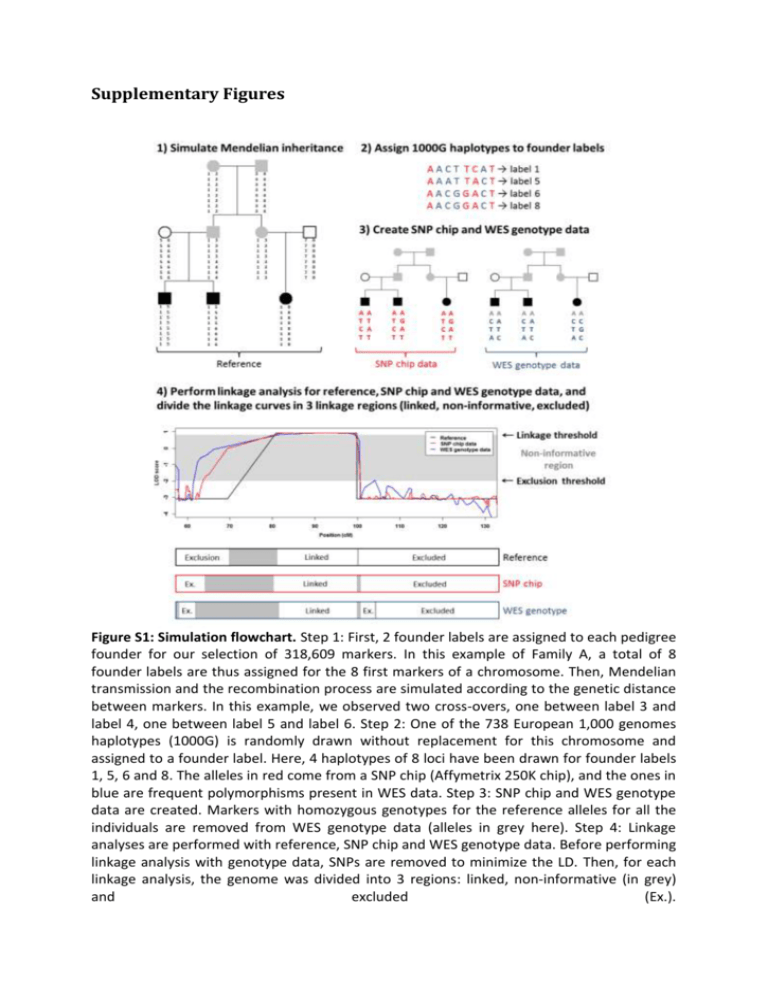
Supplementary Figures Figure S1: Simulation flowchart. Step 1: First, 2 founder labels are assigned to each pedigree founder for our selection of 318,609 markers. In this example of Family A, a total of 8 founder labels are thus assigned for the 8 first markers of a chromosome. Then, Mendelian transmission and the recombination process are simulated according to the genetic distance between markers. In this example, we observed two cross-overs, one between label 3 and label 4, one between label 5 and label 6. Step 2: One of the 738 European 1,000 genomes haplotypes (1000G) is randomly drawn without replacement for this chromosome and assigned to a founder label. Here, 4 haplotypes of 8 loci have been drawn for founder labels 1, 5, 6 and 8. The alleles in red come from a SNP chip (Affymetrix 250K chip), and the ones in blue are frequent polymorphisms present in WES data. Step 3: SNP chip and WES genotype data are created. Markers with homozygous genotypes for the reference alleles for all the individuals are removed from WES genotype data (alleles in grey here). Step 4: Linkage analyses are performed with reference, SNP chip and WES genotype data. Before performing linkage analysis with genotype data, SNPs are removed to minimize the LD. Then, for each linkage analysis, the genome was divided into 3 regions: linked, non-informative (in grey) and excluded (Ex.). 80,938 SNVs 9,301 INDELs Missense, nonsense, splice-site, and INDEL frameshifts 14,498 SNVs 2,572 INDELs Genotypes coherent with the disease model (All individuals heterozygous or not covered) 1,420 SNVs 227 INDELs Frequency below 0.1 % in 3 reference samples 6 SNVs 3 INDELs Figure S2: WES filtering strategy and data for Family A. The reference samples are the European of 1,000 genomes project, the European American of exome variant server, and a control database of IntegraGen. 42,964 SNVs 3,336 INDELs Missense, nonsense, splice-site, and INDEL frameshifts 13,215 SNVs 2,459 INDELs All individuals heterozygous or not covered All individuals homozygous or not covered 3,144 SNVs 535 INDELs 2,423 SNVs 408 INDELs Frequency below 1 % in 3 reference samples Frequency below 1 % in 3 reference samples 6 SNVs 1 INDEL 101 SNVs 2 INDELs Gene with at least 2 candidate variants 2 SNVs 0 INDEL Figure S3: WES filtering strategy and data for Family B. The reference samples are the European of 1,000 genomes project, the European American of exome variant server, and a control database of IntegraGen. (For legend see next page.) Figure S4: Marker selection in simulated datasets. Each boxplot shows values computed on 100 replicates, with a marker selection according to different physical length bins. Red and blue lines represent the median of values computed with all the markers (i.e. without marker selection). The second row (Non-Informative) shows the genetic length of the genome with a LOD score computed on genetic data between -2 and the linkage threshold (0.8, 2.6 and 1.1 for Families A, B and B-nuclear, respectively). The third row (False Positive) shows the genetic length of the genome with a LOD score computed on the genetic data higher than the linkage threshold, and with a REF LOD score below -2. The fourth row (False Negative) shows the genetic length of the genome with a LOD score computed on the genetic data below -2, and with a REF LOD higher than the linkage threshold. The fifth row (True Positive) shows the genetic length of the genome with a REF LOD score and a LOD score computed on the genetic data higher than the linkage threshold. The last row (True Negative) shows the genetic length of the genome with a REF LOD score and a LOD score computed on the genetic data below -2. Figure S5: Strong linkage disequilibrium leads to false negative signals in Family A. Figure (A) shows an example of haplotype inheritance in Family A. Each color represents a different founder origin. Here, we observe a linkage region, surrounded in green, with a purple haplotype shared by all affected individuals. Figure (B) shows haplotype reconstruction by a multipoint approach, such as Merlin, in presence of linkage disequilibrium (LD). In situation of strong LD, haplotype frequencies are incorrectly estimated because they are estimated by multiplying allele frequencies together: it is thus more likely to observe a single rare haplotype (the one in green in individual A3), than to observe 3 rare haplotypes with 2 recombinations. Figure S6: Exclusion by linkage analysis of candidate heterozygous variants B8 and B9, located on the same haplotype, in the recessive Family B. This figure shows the haplotype reconstruction obtained with Merlin around the heterozygous candidate variants of Family B from both SNP chip and WES genotype data. Each color represents a different founder origin. Here, only one haplotype is shared identical by descent (the orange one), proving that the 2 candidate variants are on this haplotype. Supplementary Tables Table S1: Characteristics of SNP chip and WES markers used in the simulations Intermarker distances (bp) # markers All markers WES SNP chip Family A WES a a SNP chip Family B a SNP chip a WES a 1st decile Median 9th decile # gaps > 250 kb > 500 kb > 1000 kb 248,290 166 4,879 27,402 137 48 26 71,206 47 2,952 67,524 2,169 974 384 132,804 254 8,631 49,119 538 106 30 43,981 67 5,212 121,022 2,358 1,109 455 248,290 166 4,879 27,402 137 48 26 43,225 70 5,440 124,949 2,358 1,106 454 the average of numbers of markers, distances and gaps used in the 100 replicates are presented. Table S2: Linkage analysis performance in simulated datasets before minimizing linkage disequilibrium SNP chip WES Exclusion NI Linkage Exclusion NI Linkage b Exclusion 2834.75 312.56 10.51 2316.91 840.08 7.46 NI 0.85 1.33 0.53 0.72 8.98 0.48 c Linkage 14.39 138.88 283.2 7.49 208.7 220.55 2849.99 458.77 294.24 2325.12 1057.76 228.49 Exclusion 3156.68 233.67 1.32 3133.75 249.98 0.04 NI 10.39 207.95 2.14 0.79 218.55 0.10 d Linkage 0.00 0.23 7.22 0.00 2.15 5.26 3167.06 441.85 10.68 3134.54 470.68 5.40 Exclusion 3065.61 289.43 27.73 2992.75 376.13 6.06 NI 0.01 6.11 0.81 0.08 6.26 0.36 e Linkage 0.02 3.16 226.72 0.25 27.53 201.20 3065.64 298.71 255.26 2993.07 409.92 207.62 a reference LOD score; b genetic length in cM; c linkage threshold = 0.8; d linkage threshold = 2.6; linkage threshold = 1.1. Family B-nuclear Family B Family A REF a e Table S3: Characteristics of the WES candidate variants of Families A and B Family A Family B e Family B-nuclear e Type Genotypes a LOD score SNP chip data b LOD score WES data b Sanger sequencing c Variant A1 SNV HET/HET/HET [0.90 ; 0.90] [0.85 ; 0.85] Validated Variant A2 SNV HET/HET/HET [0.90 ; 0.90] [0.90 ; 0.90] Validated Variant A3 SNV HET/HET/HET [0.90 ; 0.90] [0.90 ; 0.90] Validated Variant A4 SNV HET/HET/HET [0.86 ; 0.86] [0.88 ; 0.88] Validated Variant A5 SNV HET/HET/HET [0.89 ; 0.89] [0.90 ; 0.90] Validated Variant A6 SNV HET/NC/NC [-2.51 ; -2.93] [-3.38 ; -3.38] Not validated Variant A7 INDEL HET/HET/HET [-2.59 ; -2.70] [-1.43 ; -1.46] Not validated Variant A8 INDEL HET/HET/HET [-4.38 ; -4.41] [-4.11 ; -4.02] Inconclusive d Variant A9 INDEL HET/HET/HET [-3.07 ; -2.94] [-3.10 ; -3.08] Not validated Variant B1 SNV HOM/NC/NC [-2.39 ; -3.23] [-2.52 ; -2.05] Not validated Variant B2 SNV HOM/NC/NC [-5.83 ; -5.59] [-2.49 ; -2.49] Not validated Variant B3 SNV HOM/NC/NC [-3.16 ; -5.68] [-INF ; -INF] Not validated Variant B4 SNV HOM/NC/NC [-5.34 ; -5.31] [-INF ; -INF] Not validated Variant B5 SNV HOM/HOM/HOM [2.61 ; 2.61] [2.61 ; 2.61] Validated Variant B6 SNV HOM/NC/NC [-10.78 ; -INF] [-INF ; -INF] Not validated Variant B7 INDEL HOM/HOM/HOM [2.61 ; 2.61] [2.59 ; 2.61] Inconclusive Variant B1 SNV HOM/NC/NC [-1.80 ; -2.57] [-1.99 ; -1.37] Not validated Variant B2 SNV HOM/NC/NC [-4.70 ; -4.46] [-1.69 ; -1.69] Not validated Variant B3 SNV HOM/NC/NC [-2.55 ; -5.68] [-INF ; -INF] Not validated Variant B4 SNV HOM/NC/NC [-4.76 ; -4.74] [-INF ; -INF] Not validated Variant B5 SNV HOM/HOM/HOM [1.20 ; 1.20] [1.20 ; 1.20] Validated Variant B6 SNV HOM/NC/NC [-10.12 ; -INF] [-INF ; -INF] Not validated INDEL HOM/HOM/HOM [1.20 ; 1.20] [1.18 ; 1.20] Inconclusive SNV HET/HET/HET [-INF ; -5.79] [-INF ; -INF] Validated Variant B7 Variant B8 f f Variant B9 SNV HET/HET/HET [-5.79 ; -5.78] [-INF ; -INF] Validated b genotypes of the candidate variants for the 3 affected individuals of each Family; LOD scores of the 2 closest markers bracketing the candidate variants; c validation status by Sanger sequencing; d inconclusive INDELs are located in stretches of Poly-A/Poly-T, which sequences are difficult to interpret; e variants B1 to B7 of Family B and Family B-nuclear are the same; f variants located on the same gene. HOM: homozygote; HET: heterozygote; NC: not covered; INF: infinity. a
