Exam
advertisement
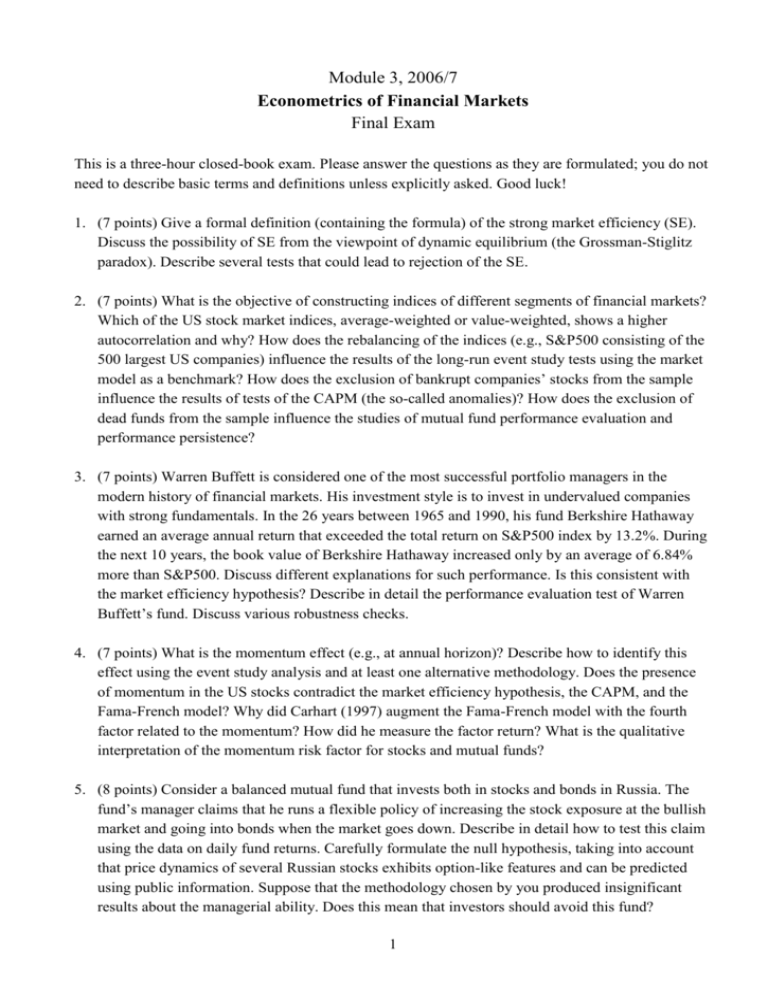
Module 3, 2006/7 Econometrics of Financial Markets Final Exam This is a three-hour closed-book exam. Please answer the questions as they are formulated; you do not need to describe basic terms and definitions unless explicitly asked. Good luck! 1. (7 points) Give a formal definition (containing the formula) of the strong market efficiency (SE). Discuss the possibility of SE from the viewpoint of dynamic equilibrium (the Grossman-Stiglitz paradox). Describe several tests that could lead to rejection of the SE. 2. (7 points) What is the objective of constructing indices of different segments of financial markets? Which of the US stock market indices, average-weighted or value-weighted, shows a higher autocorrelation and why? How does the rebalancing of the indices (e.g., S&P500 consisting of the 500 largest US companies) influence the results of the long-run event study tests using the market model as a benchmark? How does the exclusion of bankrupt companies’ stocks from the sample influence the results of tests of the CAPM (the so-called anomalies)? How does the exclusion of dead funds from the sample influence the studies of mutual fund performance evaluation and performance persistence? 3. (7 points) Warren Buffett is considered one of the most successful portfolio managers in the modern history of financial markets. His investment style is to invest in undervalued companies with strong fundamentals. In the 26 years between 1965 and 1990, his fund Berkshire Hathaway earned an average annual return that exceeded the total return on S&P500 index by 13.2%. During the next 10 years, the book value of Berkshire Hathaway increased only by an average of 6.84% more than S&P500. Discuss different explanations for such performance. Is this consistent with the market efficiency hypothesis? Describe in detail the performance evaluation test of Warren Buffett’s fund. Discuss various robustness checks. 4. (7 points) What is the momentum effect (e.g., at annual horizon)? Describe how to identify this effect using the event study analysis and at least one alternative methodology. Does the presence of momentum in the US stocks contradict the market efficiency hypothesis, the CAPM, and the Fama-French model? Why did Carhart (1997) augment the Fama-French model with the fourth factor related to the momentum? How did he measure the factor return? What is the qualitative interpretation of the momentum risk factor for stocks and mutual funds? 5. (8 points) Consider a balanced mutual fund that invests both in stocks and bonds in Russia. The fund’s manager claims that he runs a flexible policy of increasing the stock exposure at the bullish market and going into bonds when the market goes down. Describe in detail how to test this claim using the data on daily fund returns. Carefully formulate the null hypothesis, taking into account that price dynamics of several Russian stocks exhibits option-like features and can be predicted using public information. Suppose that the methodology chosen by you produced insignificant results about the managerial ability. Does this mean that investors should avoid this fund? 1 (4 bonus points) Describe how to test this claim using the data on quarterly portfolio holdings of the fund. 6. (8 points) Describe briefly three approaches used to construct multi-factor models of stock returns. So far, there have been practically no studies of multiple risk factors in the Russian stock market, which has a relatively short history and is characterized by high returns and volatility, low liquidity of most stocks, and high concentration (in the companies extracting natural resources). Which of the three approaches of identifying the risk factors seems most suitable for the Russian market, taking into account its specifics? Motivate your choice. Describe briefly the steps in the methodology you would take under this approach. Which factors are most likely to turn out significant, according to your prior expectations? What risks do they proxy for? 7. (8 points) Describe the general Fama-MacBeth approach to testing CAPM, without going into details specific for particular studies, such as the original study by Fama&MacBeth (1973) or Fama&French (1991). Discuss how the null is formulated and the relevant test statistics are computed. Why is this test usually applied to portfolios formed on the basis of certain company characteristics rather than to individual stocks? Discuss how the portfolio formation methods changed over time. Why did Fama&French (1991) apply the second stage of the test to individual stocks and how did they measure stocks’ betas? How did Ferson&Harvey (1998) modify the test using a conditional approach? 8. (8 points) Suppose that you have a data base with daily US growth fund returns in 1990-2005, which includes only surviving funds. According to the tournament hypothesis, funds lagging behind after the first semester increase risk in the second semester more than interim winners do. Describe the regression-based and contingency table methodologies of testing this hypothesis. Address the issues of measuring risk, measurement error, survivor bias, and cross-correlation in fund returns. Discuss the relative advantages of the two methods. 2
