MEC_figs1
advertisement
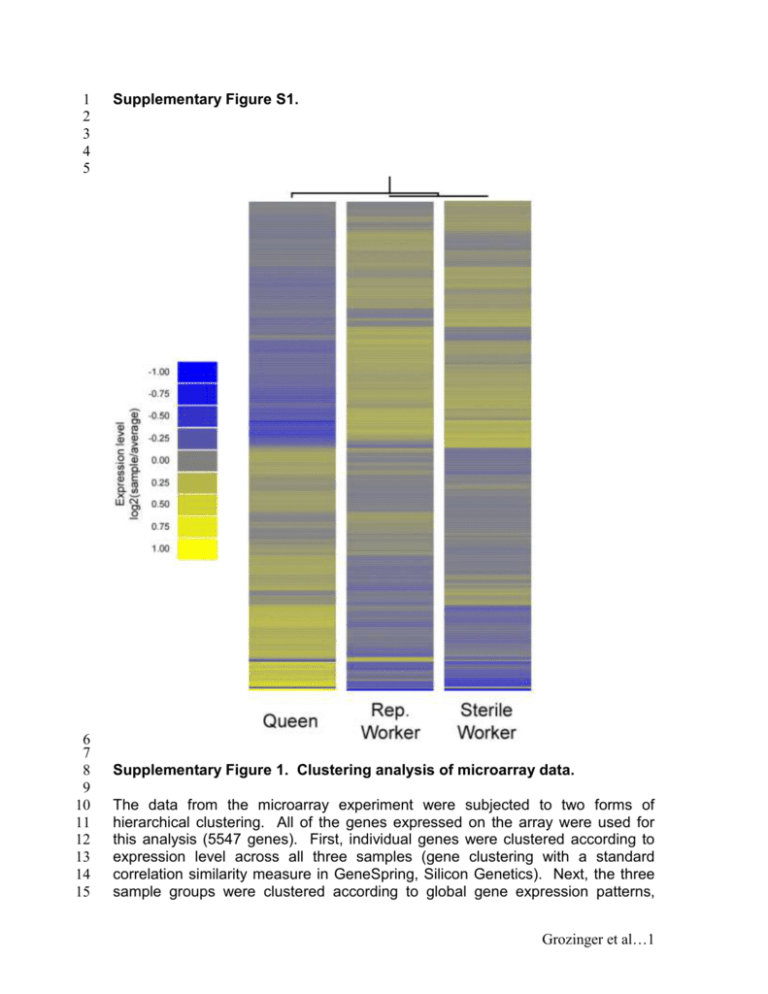
1 2 3 4 5 6 7 8 9 10 11 12 13 14 15 Supplementary Figure S1. Supplementary Figure 1. Clustering analysis of microarray data. The data from the microarray experiment were subjected to two forms of hierarchical clustering. All of the genes expressed on the array were used for this analysis (5547 genes). First, individual genes were clustered according to expression level across all three samples (gene clustering with a standard correlation similarity measure in GeneSpring, Silicon Genetics). Next, the three sample groups were clustered according to global gene expression patterns, Grozinger et al…1 16 17 18 19 20 21 using condition tree clustering with a standard correlation similarity measure (GeneSpring, Silicon Genetics). Each gene’s ‘expression level’ is the log2(expression level in each sample/average expression level across all three sample groups). Grozinger et al…2


