JCC_21409_sm_SuppMaterials
advertisement
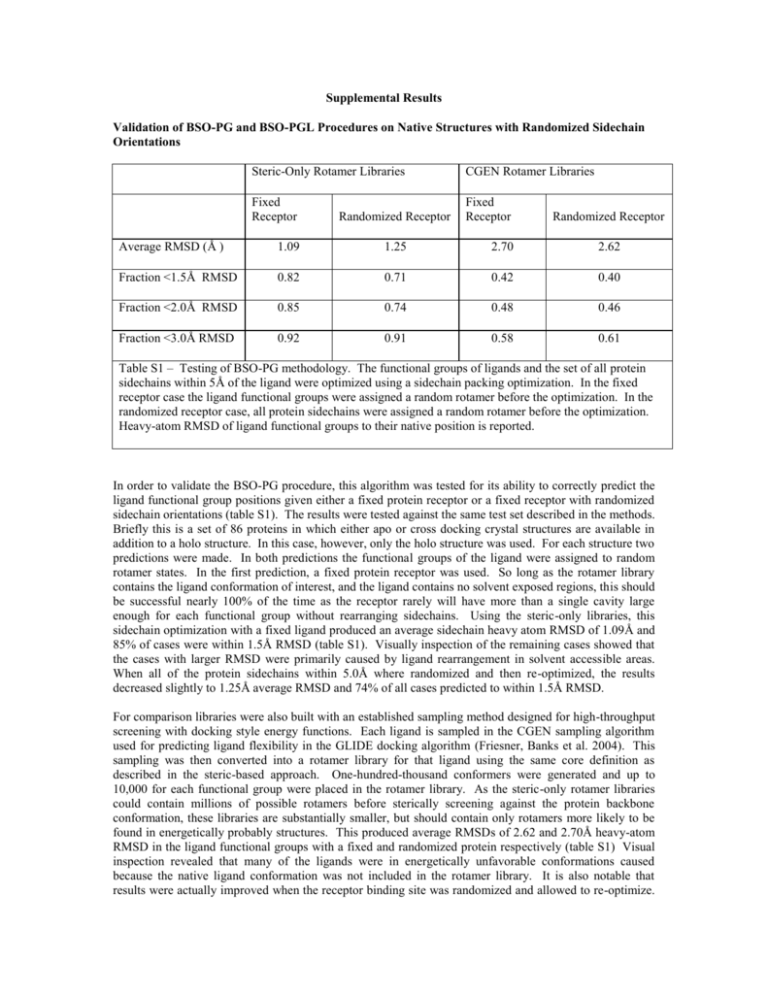
Supplemental Results Validation of BSO-PG and BSO-PGL Procedures on Native Structures with Randomized Sidechain Orientations Steric-Only Rotamer Libraries CGEN Rotamer Libraries Fixed Receptor Fixed Receptor Randomized Receptor Randomized Receptor Average RMSD (Å ) 1.09 1.25 2.70 2.62 Fraction <1.5Å RMSD 0.82 0.71 0.42 0.40 Fraction <2.0Å RMSD 0.85 0.74 0.48 0.46 Fraction <3.0Å RMSD 0.92 0.91 0.58 0.61 Table S1 – Testing of BSO-PG methodology. The functional groups of ligands and the set of all protein sidechains within 5Å of the ligand were optimized using a sidechain packing optimization. In the fixed receptor case the ligand functional groups were assigned a random rotamer before the optimization. In the randomized receptor case, all protein sidechains were assigned a random rotamer before the optimization. Heavy-atom RMSD of ligand functional groups to their native position is reported. In order to validate the BSO-PG procedure, this algorithm was tested for its ability to correctly predict the ligand functional group positions given either a fixed protein receptor or a fixed receptor with randomized sidechain orientations (table S1). The results were tested against the same test set described in the methods. Briefly this is a set of 86 proteins in which either apo or cross docking crystal structures are available in addition to a holo structure. In this case, however, only the holo structure was used. For each structure two predictions were made. In both predictions the functional groups of the ligand were assigned to random rotamer states. In the first prediction, a fixed protein receptor was used. So long as the rotamer library contains the ligand conformation of interest, and the ligand contains no solvent exposed regions, this should be successful nearly 100% of the time as the receptor rarely will have more than a single cavity large enough for each functional group without rearranging sidechains. Using the steric-only libraries, this sidechain optimization with a fixed ligand produced an average sidechain heavy atom RMSD of 1.09Å and 85% of cases were within 1.5Å RMSD (table S1). Visually inspection of the remaining cases showed that the cases with larger RMSD were primarily caused by ligand rearrangement in solvent accessible areas. When all of the protein sidechains within 5.0Å where randomized and then re-optimized, the results decreased slightly to 1.25Å average RMSD and 74% of all cases predicted to within 1.5Å RMSD. For comparison libraries were also built with an established sampling method designed for high-throughput screening with docking style energy functions. Each ligand is sampled in the CGEN sampling algorithm used for predicting ligand flexibility in the GLIDE docking algorithm (Friesner, Banks et al. 2004). This sampling was then converted into a rotamer library for that ligand using the same core definition as described in the steric-based approach. One-hundred-thousand conformers were generated and up to 10,000 for each functional group were placed in the rotamer library. As the steric-only rotamer libraries could contain millions of possible rotamers before sterically screening against the protein backbone conformation, these libraries are substantially smaller, but should contain only rotamers more likely to be found in energetically probably structures. This produced average RMSDs of 2.62 and 2.70Å heavy-atom RMSD in the ligand functional groups with a fixed and randomized protein respectively (table S1) Visual inspection revealed that many of the ligands were in energetically unfavorable conformations caused because the native ligand conformation was not included in the rotamer library. It is also notable that results were actually improved when the receptor binding site was randomized and allowed to re-optimize. This could be because while the CGEN rotamer library did not have the native conformation it had a nearnative conformation that could be accommodated in the receptor structure if some of the surrounding sidechains were optimized for this conformation. The CGEN approach was designed for use with lower resolution docking-style function and therefore is probably not ideal for this purpose. The CGEN approach does speed up the optimization of the ligand functional groups substantially as there are an order of magnitude fewer rotamer to evaluate. However as the bulk of the time for the optimization of the protein sidechains around a flexible ligand is taken up by the optimization of the protein sidechains, this gain is not significant as part of the overall algorithm. The BSO-PGL algorithm was tested in a similar way to the BSO-PG using the same test set. In this case the ligand core position was randomized in addition to the ligand functional group orientations. The ligand core was placed in an arbitrary position within 1.4Å and 25° of rigid body rotation of the native position for 86 test cases. For each test case the BSO-PGL algorithm was used to attempt to recreate the native structure with either a fixed protein receptor or a protein receptor in which all of the sidechains within 5Å were assigned to random rotamer states. A search area of 1.5Å and 30° of rigid body movement was set for the ligand and 10 clusters were scored for each ligand-receptor pair. Surprisingly, the results were improved with a randomized receptor verses a fixed receptor for all cases. This could be due to the same reasons that the results were improved in the BSO-PG case with CGEN rotamer libraries. Since only 10 positions are scored with the full energy function with full ligand and sidechain flexibility, there is probably a degree of undersampling. A fixed receptor does not allow a near-native ligand core position score well as the receptor is not allowed to adapt to it, whereas a flexible receptor is able to adapt and produce an energetically favorable conformation. The average RMSD using the steric-only rotamer libraries was 2.02Å RMSD with 70% of the test set correctly predicted to within 2.0Å heavy-atom RMSD (table S2). Again results were worse with the CGEN rotamer libraries than with the steric-only rotamer libraries for the same reasons as in the BSO-PG case. Steric-Only Rotamer Libraries CGEN Rotamer Libraries Fixed Receptor Fixed Receptor Randomized Receptor Randomized Receptor Average RMSD (A) 2.02 1.93 2.58 2.68 Fraction <1.5A RMSD 0.44 0.53 0.39 0.39 Fraction <2.0A RMSD 0.65 0.69 0.52 0.52 Fraction <3.0A RMSD 0.81 0.78 0.65 0.65 Table S2 – Testing of BSO-PGL methodology. The positions and conformations of ligands and the protein sidechains within 5Å of the ligand were optimized using the BS0-PGL hierarchal prediction method. In the fixed receptor case the ligand functional groups were assigned a random rotamer before the optimization and the ligand core was placed at a random position within 1.4Å and 25° of the native conformation. In the randomized receptor case, all protein sidechains were assigned a random rotamer before the optimization. Heavy-atom RMSD of ligands to their native position is reported. Further testing was conducted as to the size of the region that could be effectively sampled by this BSOPGL algorithm, again using this set of simplified test systems. Just as in hierarchal loop prediction there should be a relationship between the size of the sample space and the number of clusters required. For a constant number of clusters, 10 in this case, the sampling space was expanded from 0.5Å to 2.5Å in displacement and 10° to 50° in rotation. The ligand was placed at a random position within a slightly smaller (0.1Å 5°) space with all the protein sidechains and ligand functional groups assigned to random conformations. The heavy atom RMSD of the highest scoring cluster was then compared to the native holo structure (Table S3). As the search space expanded the scoring became less accurate. Since there are a constant number of clusters scored, there are more varied conformations within each cluster as the search space increases. Within each cluster, the RMSD of the central core region was calculated to the cluster representative before refinement. The maximum RMSD is a measure of the variation within the cluster which the scoring method will have to tolerate to produce accurate results. The average value over all the clusters generated is presented in table S3. When limited to 10 clusters a search space of 2.0Å and 40°, corresponding to a within cluster RMSD of 0.56Å, appears to be the maximum capable of generating fairly accurate results as accuracy begins to decrease more radically at this stage. Any search space larger than this would most likely require more clusters to be scored to maintain this resolution required for accurate results. A search space range of 1.5Å and 30° was used in this paper so as to be more conservative and reduce the effect of the number of clusters scored on the final results. The RMSD variation within clusters for the BSO-PGL algorithm presented in table 5 was also calculated and approximately equal variation (0.44Å) was noted here as for the equivalent search space in table S3 (1.5Å 30°). Steric-Only Rotamer Libraries Sampling Range for Ligand 0.5Å - 10° 1.0Å – 20° 1.5Å – 30° 2.0Å – 40° 2.5Å - 50° Maximum RMSD to Cluster Representative within each group (Å) 0.14 0.23 0.42 0.56 0.70 Average RMSD (Å) 1.58 1.80 1.93 2.12 2.35 Fraction <1.5Å RMSD 0.76 0.53 0.53 0.50 0.43 Fraction <2.0Å RMSD 0.86 0.71 0.69 0.65 0.57 Fraction <3.0Å RMSD 0.91 0.83 0.78 0.76 0.72 Table S3 – Success of BSO-PGL algorithm for different size sampling regions. The positions and conformations of ligands and the protein sidechains within 5Å of the ligand were optimized using the BS0PGL hierarchal prediction method. In the fixed receptor case the ligand functional groups were assigned a random rotamer before the optimization. All protein sidechains were assigned a random rotamer before the optimization. Heavy-atom RMSD of ligands to their native position is reported. The RMSD before refinement within each cluster was also reported.
