Title: Attention Problems and CNVs
advertisement
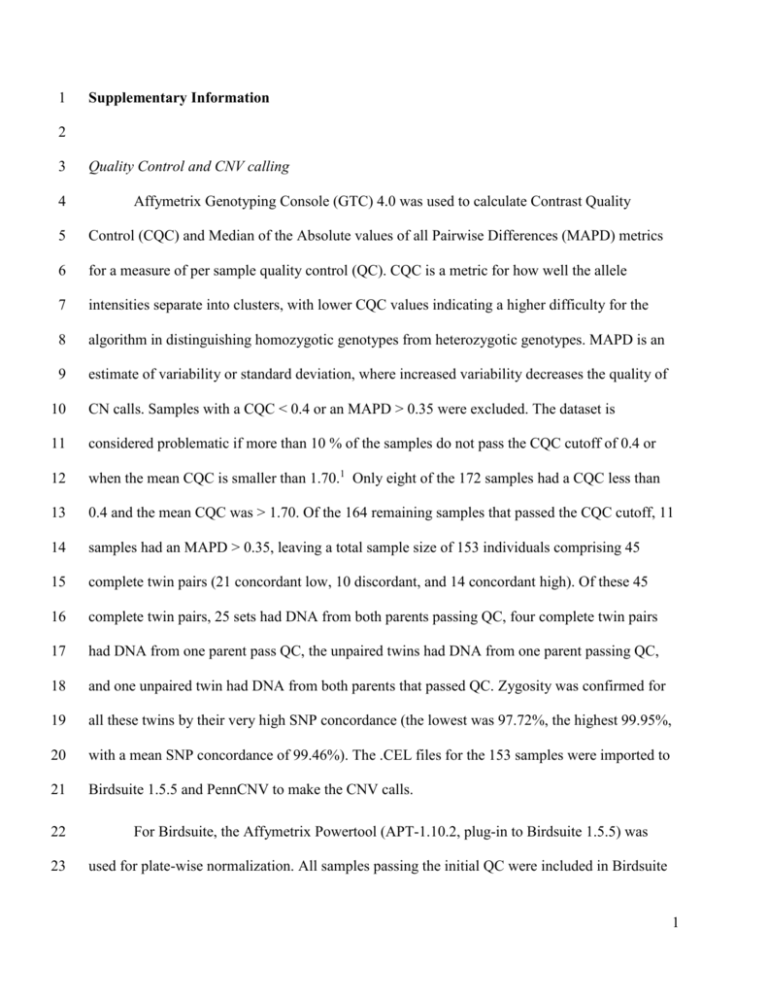
1 Supplementary Information 2 3 4 Quality Control and CNV calling Affymetrix Genotyping Console (GTC) 4.0 was used to calculate Contrast Quality 5 Control (CQC) and Median of the Absolute values of all Pairwise Differences (MAPD) metrics 6 for a measure of per sample quality control (QC). CQC is a metric for how well the allele 7 intensities separate into clusters, with lower CQC values indicating a higher difficulty for the 8 algorithm in distinguishing homozygotic genotypes from heterozygotic genotypes. MAPD is an 9 estimate of variability or standard deviation, where increased variability decreases the quality of 10 CN calls. Samples with a CQC < 0.4 or an MAPD > 0.35 were excluded. The dataset is 11 considered problematic if more than 10 % of the samples do not pass the CQC cutoff of 0.4 or 12 when the mean CQC is smaller than 1.70.1 Only eight of the 172 samples had a CQC less than 13 0.4 and the mean CQC was > 1.70. Of the 164 remaining samples that passed the CQC cutoff, 11 14 samples had an MAPD > 0.35, leaving a total sample size of 153 individuals comprising 45 15 complete twin pairs (21 concordant low, 10 discordant, and 14 concordant high). Of these 45 16 complete twin pairs, 25 sets had DNA from both parents passing QC, four complete twin pairs 17 had DNA from one parent pass QC, the unpaired twins had DNA from one parent passing QC, 18 and one unpaired twin had DNA from both parents that passed QC. Zygosity was confirmed for 19 all these twins by their very high SNP concordance (the lowest was 97.72%, the highest 99.95%, 20 with a mean SNP concordance of 99.46%). The .CEL files for the 153 samples were imported to 21 Birdsuite 1.5.5 and PennCNV to make the CNV calls. 22 23 For Birdsuite, the Affymetrix Powertool (APT-1.10.2, plug-in to Birdsuite 1.5.5) was used for plate-wise normalization. All samples passing the initial QC were included in Birdsuite 1 1 (including the separate parents that were not included in further downstream analyses to aid in the 2 estimation of the probe-specific means and variances used in the Birdseye algorithm).2 The 3 Birdseye algorithm from Birdsuite 1.5.5 was one of the two algorithms used to make the CN 4 calls. This algorithm searches for consistent evidence for CNVs across multiple neighboring 5 probes. Information from neighboring probes is integrated into a copy number (CN) call (0, 1, 2, 6 3 or 4) for the segment covered by the probes using a hidden Markov model (HMM) based 7 algorithm.2 Birdsuite only calls CNs up to 4, because the Affymetrix platform is not designed for 8 detecting CNs above this level. Higher-order CNs will likely be called as 4 due to saturation of 9 probe intensities. A logarithm of the odds ratio (LOD) score was generated for each CNV 10 segment, indicating the likelihood of a CNV relative to no CNV in the region. CNV segments 11 were only included if they had a LOD-score > 10. An additional level of CNV quality control was 12 generated by also calling CNVs with a second algorithm (PennCNV). 13 PennCNV (Aug. 2010 version), with a workflow described elsewhere,3 was used to call 14 genotypes, extract allele-specific signal intensities, cluster canonical genotypes and finally 15 generate a standard input file including log-R ratio (LRR) values and the “B allele” frequency 16 (BAF) for each marker in each individual. PennCNV uses a HMM based approach for kilobase- 17 resolution detection of CNVs. Copy number (CN) calls (0, 1, 2, 3, and 4) for fragments on 18 chromosomes were generated with at least 2 markers. A “genomic waves” effect in calling CNVs 19 was determined by checking whether waviness factor is less than -0.04 or higher than 0.04 and 20 this effect was minimized through an improved version of wave adjustment procedure in 21 PennCNV. CNVs on chromosome X and Y were called by following a specific protocol. 22 The CN calls of Birdsuite and PennCNV were compared with a script written in Perl 23 (scripts available in the Supplementary Material). CN segments were only included in further 24 analyses if the following conditions were met: 1) the CN calls agreed between both algorithms, 2) 2 1 the overlapping part of the segments from both algorithms was > 100 kb, and 3) the segment was 2 not in a centromere. Calls were also included if the CN call in Birdsuite was equal to the expected 3 CN (CN = 2 for autosomes, CN = 1 & 1 and CN = 2 & 0 for X and Y in males and females 4 respectively) and the segment was not present in the PennCNV output, since PennCNV only 5 gives the CN state when the CN deviates from the expected CN, and Birdsuite gives CN states for 6 all segments. Since calling algorithms can produce artificially split CNV calls, adjacent CNV 7 calls were merged after manual inspection of LRR and BAF plots, if the gap in between was ≤ 8 50% of the entire length of the newly merged CNV (see Supplementary Figure 1 for LRR and 9 BAF plots of all these CNVs). After QC, the highest observed per-sample LRR SD of the probes 10 in the remaining CNVs was 0.154. 11 12 13 De novo CNV validation with qPCR The CN of regions with possible de novo CNVs (pre- and post-twinning) was re- 14 examined with quantitative Real-Time Polymerase Chain Reaction (qPCR) utilizing TaqMan 15 fluorescently labeled oligonucleotide DNA probes; using RNaseP as an internal reference and a 16 differentially labeled fluorescent probe for the target of interest within the putative CNV. A PCR 17 reaction was performed with the genomic DNA and both probe/primer sets. Briefly, 10ng of 18 genomic DNA was mixed with 1X TaqMan Genotyping MasterMix, 1X VIC labeled RNaseP 19 assay mix (internal reference), and 1X FAM labeled target assay mix using DH2O for a final 20 reaction volume of 10µl (Applied Biosystems, Foster City, CA, USA). Each sample was 21 replicated at least four times for accuracy. Cycling conditions consisted of an initial denaturation 22 at 95C for 10 minutes, 40 cycles of denaturation at 95C for 15 sec, and annealing and 23 elongation at 60C for 60 sec on an Applied Biosystems 7900HT Real-time PCR machine. Raw 3 1 data (CT) was exported to CopyCaller Software V1.0 (Applied Biosystems, Foster City, CA, 2 USA). Copy Number calls were determined using the software algorithm (copy number 3 assignment without a calibrator sample) when compared to the reference signal from RNaseP, 4 which is assumed to be present at 2 copies in a diploid organism. The CopyCaller Software 5 provides a CN calculated value and a CN predicted value from the raw data. Although the integer 6 for CN calculated could be a whole number with a fractional part, the predicted CN is a whole 7 number (0,1,2,3, etc.) derived from the calculated CN. 8 9 10 11 12 13 14 15 16 17 18 19 20 21 22 23 4 References 1. Affymetrix: Affymetrix White Paper: Quality Control Assessment in Genotyping Console. http://media.affymetrix.com/support/technical/whitepapers/genotyping_console_cqc_whit epaper.pdf 2008. 2. Korn JM, Kuruvilla FG, McCarroll SA et al: Integrated genotype calling and association analysis of SNPs, common copy number polymorphisms and rare CNVs. Nat Genet 2008; 40: 1253-1260. 3. Wang K, Li M, Hadley D et al: PennCNV: an integrated hidden Markov model designed for high-resolution copy number variation detection in whole-genome SNP genotyping data. Genome Res 2007; 17: 1665. 5 Supplementary Table 1: Pre-twinning de novo CNV events (rows in bold are confirmed by qPCR). Family ID CL/D/CH Chr Start End Size Affy 6 CN father Affy 6 CN mother Affy 6 CN twins qPCR CN father qPCR CN mother qPCR CN twins 30 CL 9 68312776 68476231 163455 2 2 1 NA NA NA 30 CL 9 69100250 69205261 105011 2 2 1 NA NA NA 34 CL 15 18728578 19399146 670568 2 2 3 2 2 3 38 CL 15 18846002 19566875 720873 2 2 1 2 3 2 39 CL 15 19393208 19548935 155727 2 2 3 NA NA NA 43 CL 17 31552238 31653809 101571 2 2 3 NA NA NA 44 CL 17 41987366 42107479 120113 2 2 1 NA NA NA 6 CH 15 18846002 19566875 720873 2 2 3 2 3 3 CL = concordant low, D = discordant, CH = concordant high. Genome coordinates are based on NCBI36/hg18. NA - Not available, qPCR probes could not be designed. 6 Supplementary Table 2: List of post-twinning de novo CNVs (rows in bold are confirmed by qPCR). Family ID CL/D /CH Chr Start End Size Affy 6 CN twin 1 Affy 6 CN twin 2 qPCR CN twin 1 qPCR CN twin 2 AP twin 1 AP twin 2 Mean AP twin 1 Mean AP twin 2 28 CL 9 43523459 43720905 197447 2 3 3 3 UA UA 47.95 43.70 29 CL 15 18522250 18655543 133294 2 1 1 1 UA UA 44.57 43.70 33 CL 1 16758722 17076084 317362 3 2 2 2 UA UA 44.16 50.43 33 CL 2 87481276 87833445 352170 3 2 3 3 UA UA 44.16 50.43 33 CL 8 12284675 12487426 202752 3 2 NA NA UA UA 44.16 50.43 38 CL 1 16741950 16843043 101094 1 2 1 1 UA UA 49.70 43.37 45 CL 1 16741950 16859438 117489 3 2 2 2 UA UA 41.38 40.32 49 CL 15 19488342 19794591 306250 1 2 NA NA UA UA 44.60 50.23 18 D 15 18866712 19195198 328487 3 2 3 3 UA A 47.63 94.06 18 D 17 5864185 5980521 116337 2 3 2 3 UA A 47.63 94.06 23 D 10 46094186 46366738 272553 2 3 NA NA UA A 49.47 65.09 26 D 8 7011977 7213846 201870 2 3 2 2 UA A 44.01 67.06 26 D 15 18522250 19080173 557924 2 3 3 3 UA A 44.01 67.06 27 D 17 41784437 42107479 323043 3 2 NA NA UA A 50.37 66.81 5 CH 4 189928060 191261904 1333844 1 2 1 2 A A 81.22 64.62 8 CH 1 147540169 147703466 163298 3 2 2 2 A A 68.28 74.34 15 CH 15 18652835 18841578 188744 2 1 1 1 A A 76.50 79.89 16 CH 15 18544080 19503764 959684 3 4 3 3 A A 80.19 CL = concordant low, D = discordant, CH = concordant high. A = affected, UA = unaffected, Twin 1 = oldest twin, Twin 2 = youngest twin. 93.65 Genome coordinates are based on NCBI36/hg18. 7 Titles and legends to figures Supplementary Figure 1. Each plot shows LogR Ratio (LRR; vertical bars) and B-allele frequency (BAF; solid points). The LRR and BAF values are shown in color in the region of the CNV (red and blue respectively), and in black in the flanking regions. The CNV that results from merging the adjacent CNVs is highlighted by a gray rectangle, and the two adjacent CNVs as called by Birdsuite and PennCNV are highlighted by a green dashed rectangle. The only CNVs that unambiguously showed two separate CNVs were the two duplications on chr9 in family 39. Both duplications were observed in both twins, and in both twins the gap in between the CNVs shows alternate clustering of B-allele frequencies and a distribution of LRR values commonly observed in copy neutral regions. As a result, these CNVs were not merged but were kept intact as two separate structural variations. Supplementary Figure 2. Each bar graph depicts the qPCR data for each of the de novo CNV regions. The bar represents the mean calculated copy number with the error line denoting the mean maximum and mean minimum copy number from each of the experimental replicates. A depicts the qPCR results from the pre-twinning de novo CNV on 15q11.2 where both twins have a CN=3 and both parents have a CN =2. B confirms the deletion on 4q35.2 of twin 1 using three different targets spaced across the CNV and C summarizes the qPCR data for the putative duplication on 17p13.2 in the affected twin (twin 2) for two different copy number target assays spaced approximately 30 kb apart. Coordinates are from hg18. 8 Supplementary Figure 3. Graphical representation of all the copy number variations from the Database of Genomic Variants (http://projects.tcag.ca/variation/) for each of the de novo CNVs identified in the study. Each CNV in the catalog is denoted by a different color bar (Blue=Gain; Red=Loss; Brown= Gain/Loss). A shows the catalogued structural variations in the region representing the pretwinning de novo CNV on 15q11.2 (chr15:18728578-19399146) where both twins have a CN=3 and both parents have a CN =2. B depicts the structural variations in the database for the region comprising the deletion on 4q35.2 (chr4:189928060-191261904) of twin 1 in a concordant affected twin pair. C summarizes a total of three small deletions in the database from the region of the putative duplication on 17p13.2 (chr17:5864185-5980521) in the affected twin (twin 2) of a discordant twin pair. All coordinates are from hg18. 9
