Supplementary Methods - Proceedings of the Royal Society B
advertisement
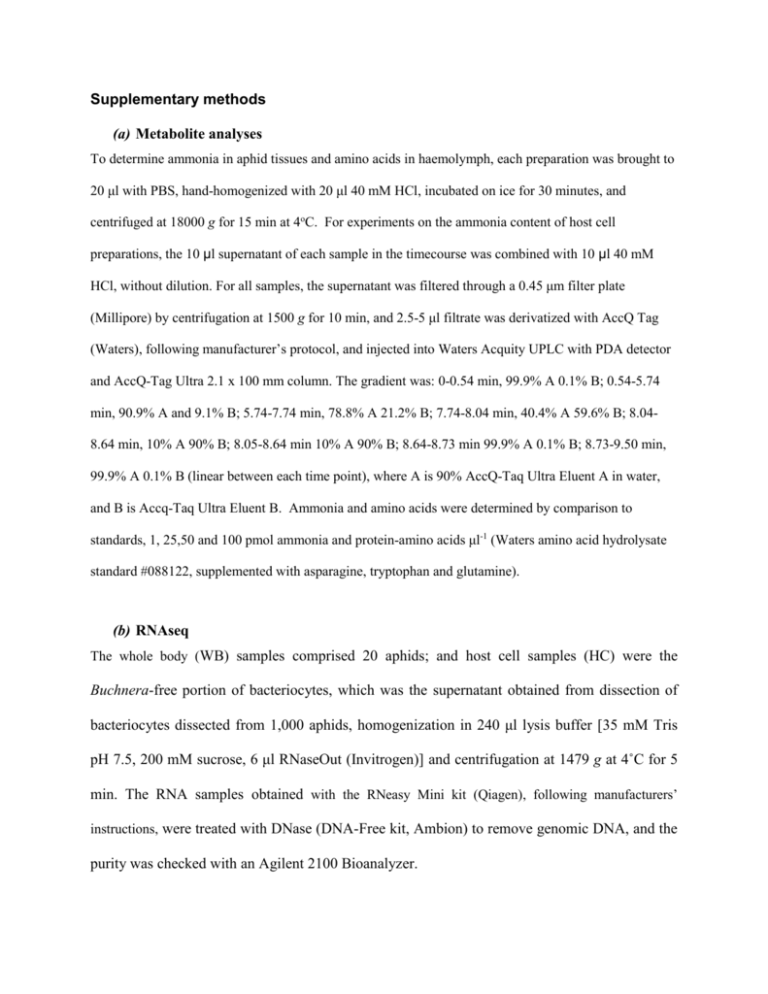
Supplementary methods (a) Metabolite analyses To determine ammonia in aphid tissues and amino acids in haemolymph, each preparation was brought to 20 μl with PBS, hand-homogenized with 20 μl 40 mM HCl, incubated on ice for 30 minutes, and centrifuged at 18000 g for 15 min at 4oC. For experiments on the ammonia content of host cell preparations, the 10 μl supernatant of each sample in the timecourse was combined with 10 μl 40 mM HCl, without dilution. For all samples, the supernatant was filtered through a 0.45 μm filter plate (Millipore) by centrifugation at 1500 g for 10 min, and 2.5-5 μl filtrate was derivatized with AccQ Tag (Waters), following manufacturer’s protocol, and injected into Waters Acquity UPLC with PDA detector and AccQ-Tag Ultra 2.1 x 100 mm column. The gradient was: 0-0.54 min, 99.9% A 0.1% B; 0.54-5.74 min, 90.9% A and 9.1% B; 5.74-7.74 min, 78.8% A 21.2% B; 7.74-8.04 min, 40.4% A 59.6% B; 8.048.64 min, 10% A 90% B; 8.05-8.64 min 10% A 90% B; 8.64-8.73 min 99.9% A 0.1% B; 8.73-9.50 min, 99.9% A 0.1% B (linear between each time point), where A is 90% AccQ-Taq Ultra Eluent A in water, and B is Accq-Taq Ultra Eluent B. Ammonia and amino acids were determined by comparison to standards, 1, 25,50 and 100 pmol ammonia and protein-amino acids μl-1 (Waters amino acid hydrolysate standard #088122, supplemented with asparagine, tryptophan and glutamine). (b) RNAseq The whole body (WB) samples comprised 20 aphids; and host cell samples (HC) were the Buchnera-free portion of bacteriocytes, which was the supernatant obtained from dissection of bacteriocytes dissected from 1,000 aphids, homogenization in 240 μl lysis buffer [35 mM Tris pH 7.5, 200 mM sucrose, 6 μl RNaseOut (Invitrogen)] and centrifugation at 1479 g at 4˚C for 5 min. The RNA samples obtained with the RNeasy Mini kit (Qiagen), following manufacturers’ instructions, were treated with DNase (DNA-Free kit, Ambion) to remove genomic DNA, and the purity was checked with an Agilent 2100 Bioanalyzer. The RNA samples were subjected to polyA+ RNA purification, RNA fragmentation, cDNA synthesis, barcode-adaptor ligation, PCR amplification, and size selection according to the instruction of Illumina mRNA sequencing sample preparation kit (Illumina). The standard PE adaptor (Illumina) was used for the HC sample and an in-house barcode-adaptor (GAACT) prepared by Cornell University Life Sciences Core Laboratories Center was used for the WB sample. The two RNAseq libraries were sequenced in a single lane for 86 bp by Illumina Genome Analyzer II platform. Illumina sequence reads were quality checked by the Illumina package programs, Firecrest, Bustard and Gerald, binned by barcode, and then trimmed of the barcode and adaptor sequences. Fastx-Toolkit (http://hannonlab.cshl.edu/fastx_toolkit/) was used to generate 36 bp reads, to enable comparison with the published data set (Hansen and Moran 2011). The RPKM values of genes (with R2 > 0.99 in all pairwise comparisons) did not vary with read lengths 36 bp, 50 bp and 80 bp. Bioinformatics programs, TopHat (Trapnell et al. 2009) and Cufflinks (Trapnell et al. 2010), were applied for mapping sequence reads into reference sequences and for computing expression scores in RPKM (reads per kilobase of transcript per million mapped reads) (Mortazavi et al. 2008). TopHat was used to map quality-filtered sequence reads to pea aphid OGS 1.0 mRNAs (Official Gene Set, representing 34,821 non redundant mRNAs) (Legeai et al. 2010) plus 13 protein-coding mitochondrial genes. The RPKM value of each gene transcript was estimated by Cufflinks based on the alignment resulting from TopHat and a GTF file providing coordinates of gene transcript boundaries. To detect genes with differential expression between the HC and WB samples, criteria of FDR ≤ 0.01 (estimated by Cuffdiff) and difference in RPKM that is both ≥ two-fold and ≥10 units were applied. To compare our data with a published transcriptome study of pea aphid bacteriocytes (Hansen and Moran 2011), the latter dataset was re-processed using our analysis pipeline to obtain RPKM values of genes and to detect genes with differential expression. (c) Construction of Buchnera metabolic model iSM199 The metabolic model iSM199 was constructed using new information to improve the previous Buchnera model iSM197 (MacDonald et al. 2011). Two reaction-specific modifications were made: the gene, ahpC, encoding alkyl hydroperoxide reductase which can reoxidise significant amounts of NADPH (Cha et al. 1995), replaced a dummy reaction in iSM197, to equilibrate NADPH and NADP pools; and the reaction D-alanine-D-alanine ligase mediated by DdlB is included, following evidence for ddlB expression (Poliakov et al. 2011), such that D-Ala (and not D-Ala-D-Ala) is taken up by Buchnera. In addition, the amino acid stoichiometries of the Buchnera biomass reaction were recalculated, using data from the experimentally determined quantitative proteome of Buchnera (Poliakov et al. 2011), to produce a biologically realistic simulation of the amino acid (AA) contribution to Buchnera protein. Specifically the AA stoichiometries in the biomass reaction (File S1) were computed from the relative abundance (NadjSPC) of each protein in the Buchnera proteome (Poliakov et al. 2011) and the AA composition of each protein retrieved from BuchneraBase (www.buchnera.org). These sequences were analysed by ProtParam (web.expasy.org/protparam/) to obtain the amino acid content of each protein. The %-abundance of each amino acid in the proteome was calculated by summing the product of its abundance in each protein and the abundance of that protein in the proteome. Amino acid stoichiometries from the biomass reaction of the iAF1260 metabolic network of Escherichia coli (Feist et al. 2007) were summed and percentages calculated for each of the twenty protein amino acids. Percentage amino acid abundances calculated from the Buchnera proteome were divided by percentage abundances calculated from the E. coli biomass reaction, and then multiplied by the amino acid stoichiometries from the E. coli biomass reaction to obtain the recalculated stoichiometries for the Buchnera biomass reaction. Cha M-K, Kim H-K, Kim I-H. 1995. Thioredoxin-linked "thiol peroxidase" from periplasmic space of Escherichia coli. Journal of Biological Chemistry 270: 28635-28641. Feist AM, Henry CS, Reed JL, Krummenacker M, Joyce AR, Karp PD, Broadbelt LJ, Hatzimanikatis V, Palsson BO. 2007. A genome-scale metabolic reconstruction for Escherichia coli K-12 MG1655 that accounts for 1260 ORFs and thermodynamic information. Mol Syst Biol 3: 121. Hansen AK, Moran NA. 2011. Aphid genome expression reveals host-symbiont cooperation in the production of amino acids. Proc Natl Acad Sci U S A 108: 2849-2854. Legeai F, Shigenobu S, Gauthier JP, Colbourne J, Rispe C, Collin O, Richards S, Wilson AC, Murphy T, Tagu D. 2010. AphidBase: a centralized bioinformatic resource for annotation of the pea aphid genome. Insect Mol Biol 19 Suppl 2: 5-12. MacDonald SJ, Thomas GH, Douglas AE. 2011. Genetic and metabolic determinants of nutritional phenotype in an insect-bacterial symbiosis. Mol Ecol 20: 2073-2084. Mortazavi A, Williams BA, McCue K, Schaeffer L, Wold B. 2008. Mapping and quantifying mammalian transcriptomes by RNA-Seq. Nat Methods 5: 621-628. Poliakov A, Russell CW, Ponnala L, Hoops HJ, Sun Q, Douglas AE, van Wijk KJ. 2011. Large-Scale LabelFree Quantitative Proteomics of the Pea aphid-Buchnera Symbiosis. Mol Cell Proteomics 10: M110 007039. Trapnell C, Pachter L, Salzberg SL. 2009. TopHat: discovering splice junctions with RNA-Seq. Bioinformatics 25: 1105-1111. Trapnell C, Williams BA, Pertea G, Mortazavi A, Kwan G, van Baren MJ, Salzberg SL, Wold BJ, Pachter L. 2010. Transcript assembly and quantification by RNA-Seq reveals unannotated transcripts and isoform switching during cell differentiation. Nat Biotechnol 28: 511-515.
