Supplementary information
advertisement
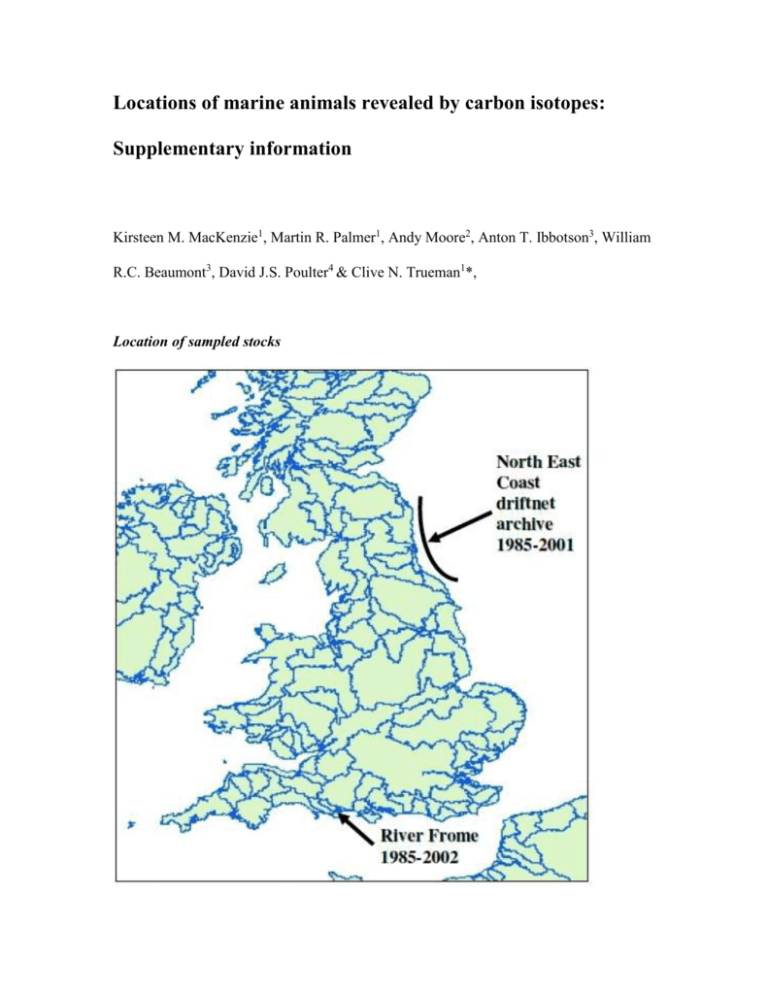
Locations of marine animals revealed by carbon isotopes: Supplementary information Kirsteen M. MacKenzie1, Martin R. Palmer1, Andy Moore2, Anton T. Ibbotson3, William R.C. Beaumont3, David J.S. Poulter4 & Clive N. Trueman1*, Location of sampled stocks Setting sample numbers To assess the isotopic variation between fish from a single wild cohort, scales of 23 fish from a wild population were measured. Using equation 1 (after62), approximately 20 fish were required to constrain δ15N values at a precision of 0.1, and approximately 2 fish for δ13C values at a precision of 0.05. t 2s 2 n (py) 2 Equation 1. Power analysis equation to estimate required sample number; n is the number of samples, t is the value of the t-distribution corresponding to the sample number (degrees of freedom) and confidence level (0.05), s is the standard deviation, p is the precision required, and ȳ is an estimate of the mean. For the sake of accuracy and precision, and for practical considerations of time, cost and sample availability, it was decided to sample approximately 10 1SW and 10 MSW fish, dependent on availability, per archive per year; this number allowed constraint of approximately 85% of variation in δ15N values. For both archives, we therefore determined δ13C and δ15N values of scales from approximately 10 1SW and 10 MSW fish for each available year between 1985 and 2002. Testing hypotheses of stock mixing Measured tissue isotope compositions can also be used as an independent test of hypotheses concerning population structure derived from tagging or fisheries data. We found highly significant differences in δ13C values between NE Coast and River Frome origin fish throughout the 18 year sampling period (ANOVA, with geographic origin as sole co-factor; n=523, df = 1, F = 116.9, p<0.001). Year and sea age both significantly influence δ13C values (Year, n = 523, df = 17, F = 9.1, p<0.001; sea age df = 1, F = 16, p<0.001), with a significant interaction between all factors. Thus, throughout the 18 year sampling period, both 1SW and MSW fish returning to the River Frome fed in different areas compared to those returning to the North East coast, and consequently salmon from southern European stocks are unlikely to share a common feeding area is rejected (at least for these populations). In the River Frome stock, sea age and year influence δ13C values (Fig. 3, ANOVA, n = 235, df = 1 and 24 respectively, F (sea age) = 69.1, F(year) = 2.8, p<0.001), indicating that salmon returning as 1SW and MSW fish fed in different areas in the season prior to return. The interaction between sea age and year was only weakly significant, (n = 235, df = 12, F = 2.0, p<0.05), suggesting that temporal variations in baseline δ13C values were similar for both age groups. In the North East Coast mixed stock, δ13C values did not vary significantly with sea age, but showed a strong variation with year (Fig. 3, ANOVA, n=289, df = 14, F = 10.4, p<0.001). The interaction between year and sea age was highly significant (n = 289, df = 11, F = 5.1, p< 0.001), suggesting that while there was no significant difference between sea ages, the two sea ages experienced different temporal patterns in baseline δ13C values in the year prior to return. Fish returning to the same region, but at different sea ages thus feed in different regions prior to return. 62. Eckblad, J. W. How many samples should be taken? Bioscience 41, 346-348 (1991).
