Trends in Discipline and the Decline in the Use of Corporal
advertisement
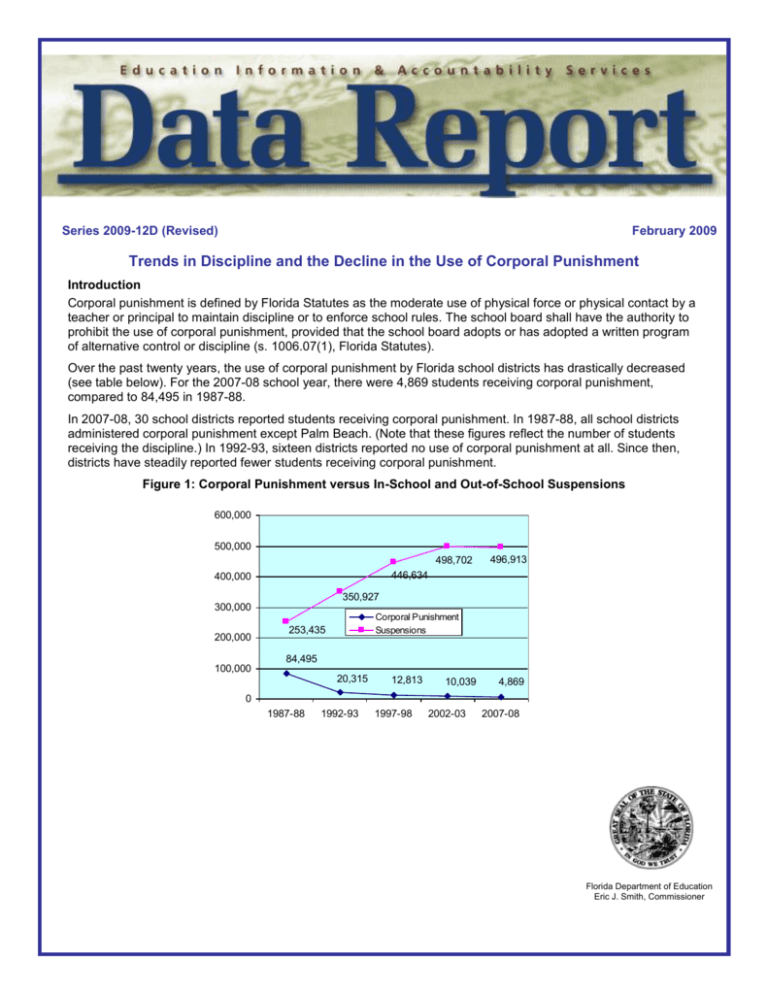
Series 2009-12D (Revised) February 2009 Trends in Discipline and the Decline in the Use of Corporal Punishment Introduction Corporal punishment is defined by Florida Statutes as the moderate use of physical force or physical contact by a teacher or principal to maintain discipline or to enforce school rules. The school board shall have the authority to prohibit the use of corporal punishment, provided that the school board adopts or has adopted a written program of alternative control or discipline (s. 1006.07(1), Florida Statutes). Over the past twenty years, the use of corporal punishment by Florida school districts has drastically decreased (see table below). For the 2007-08 school year, there were 4,869 students receiving corporal punishment, compared to 84,495 in 1987-88. In 2007-08, 30 school districts reported students receiving corporal punishment. In 1987-88, all school districts administered corporal punishment except Palm Beach. (Note that these figures reflect the number of students receiving the discipline.) In 1992-93, sixteen districts reported no use of corporal punishment at all. Since then, districts have steadily reported fewer students receiving corporal punishment. Figure 1: Corporal Punishment versus In-School and Out-of-School Suspensions 600,000 500,000 498,702 496,913 446,634 400,000 350,927 300,000 200,000 100,000 Corporal Punishment Suspensions 253,435 84,495 20,315 12,813 10,039 4,869 0 1987-88 1992-93 1997-98 2002-03 2007-08 Florida Department of Education Eric J. Smith, Commissioner Revised Discipline by Race The graphs below reflect the racial breakdown within each disciplinary action. Figure 2: Corporal Punishment Black, 26.9% Hispanic, 5.2% Asian, 0.3% White, 63.8% Am. Indian, 0.3% Multiracial, 3.5% Figure 3: In-School Suspension Black, 35.8% Hispanic, 21.9% Asian, 0.8% Am. Indian, 0.3% Multiracial, 3.1% White, 38.1% Figure 4: Out-of-School Suspension Black, 42.6% Hispanic, 18.4% Asian, 0.7% Am. Indian, 0.3% Multiracial, 3.1% White, 34.8% Figure 5: Expulsion Black, 35.1% Hispanic, 17.3% Asian, 1.1% Am. Indian, 0.7% Multiracial, 2.7% White, 43.1% 2 Revised Table 1: Student Discipline Data, 2007-08 District 1 2 3 4 5 6 7 8 9 10 11 12 13 14 15 16 17 18 19 20 21 22 23 24 25 26 27 28 29 30 31 32 33 34 35 36 37 38 39 40 41 42 43 44 45 46 47 48 49 50 51 52 53 54 55 56 57 58 59 60 61 62 63 64 65 66 67 68 72 73 74 75 ALACHUA BAKER BAY BRADFORD BREVARD BROWARD CALHOUN CHARLOTTE CITRUS CLAY COLLIER COLUMBIA DADE DESOTO DIXIE DUVAL ESCAMBIA FLAGLER FRANKLIN GADSDEN GILCHRIST GLADES GULF HAMILTON HARDEE HENDRY HERNANDO HIGHLANDS HILLSBOROUGH HOLMES INDIAN RIVER JACKSON JEFFERSON LAFAYETTE LAKE LEE LEON LEVY LIBERTY MADISON MANATEE MARION MARTIN MONROE NASSAU OKALOOSA OKEECHOBEE ORANGE OSCEOLA PALM BEACH PASCO PINELLAS POLK PUTNAM ST. JOHNS ST. LUCIE SANTA ROSA SARASOTA SEMINOLE SUMTER SUWANNEE TAYLOR UNION VOLUSIA WAKULLA WALTON WASHINGTON DEAF/BLIND FAU LAB SCH FSU CHTR SCH FAMU LAB SCH UF LAB SCH STATE Suspensions Out-of-School* In-School* 964 240 2,468 375 8,518 10,833 80 1,431 1,557 2,691 1,303 1,170 20,517 300 243 22,849 7,482 1,119 101 1,509 258 204 216 388 420 1,021 2,330 1,248 13,510 186 1,997 867 282 37 4,249 7,362 2,597 697 61 423 5,235 4,934 1,805 499 841 2,553 1,052 12,034 6,894 16,417 5,439 8,348 14,014 1,375 1,996 5,920 1,148 3,564 3,988 983 671 562 236 6,977 325 405 323 9 14 121 28 39 232,852 57 123 2,708 795 3,452 20,566 190 1,879 1,942 5,993 5,705 2,071 28,323 3 356 18,409 1,767 1,784 167 1,070 395 201 383 455 64 934 3,859 2,943 29,783 43 1,730 1,039 14 208 2,783 10,423 3,392 1,415 161 598 5,000 3,500 875 857 1,330 722 858 10,015 5,139 11,387 8,859 15,637 8,252 1,686 969 5,861 1,583 2,962 4,652 1,083 1,044 869 279 10,260 813 616 603 10 77 80 264,061 Corporal Punishment* 9 27 Expulsions 11 51 60 153 116 1 5 44 15 4 33 18 10 2 1 14 104 13 123 176 182 216 62 39 3 5 9 8 11 15 66 455 844 18 6 10 5 24 40 129 133 83 14 185 4 1 1 3 3 35 4 67 1 26 26 517 234 4 21 40 24 1 25 8 47 89 9 18 5 133 237 332 270 3 7 4,869 878 Membership 27,203 5,066 25,956 3,400 73,076 256,186 2,246 17,361 16,028 35,996 42,530 10,058 344,913 4,952 2,119 122,606 40,921 12,890 1,285 6,414 2,750 1,388 2,050 1,952 5,107 7,039 22,721 12,281 191,965 3,399 17,606 7,319 1,106 1,118 40,996 79,451 32,537 6,022 1,484 2,715 42,584 41,547 18,067 8,278 10,980 29,123 7,003 172,028 51,955 170,745 66,778 106,046 94,716 11,492 28,916 38,837 25,397 41,057 64,933 7,650 5,978 3,299 2,315 63,065 5,264 7,002 3,534 646 2,018 2,248 462 1,152 2,628,754 *These figures reflect the number of students receiving the discipline within the discipline category. *These figures reflect the number of students receiving the discipline within the discipline category. As a service to Florida school districts, each Data Report presents information on education topics of current interest. Each report is prepared by Education Information and Accountability Services, 852 Turlington Bldg., 325 W. Gaines Street, Tallahassee, Florida 32399-0400. For further information, call (850) 245-0400 or visit our web address at http://www.fldoe.org/eias. 3
