Floristic composition and forest stand structure in relation to
advertisement
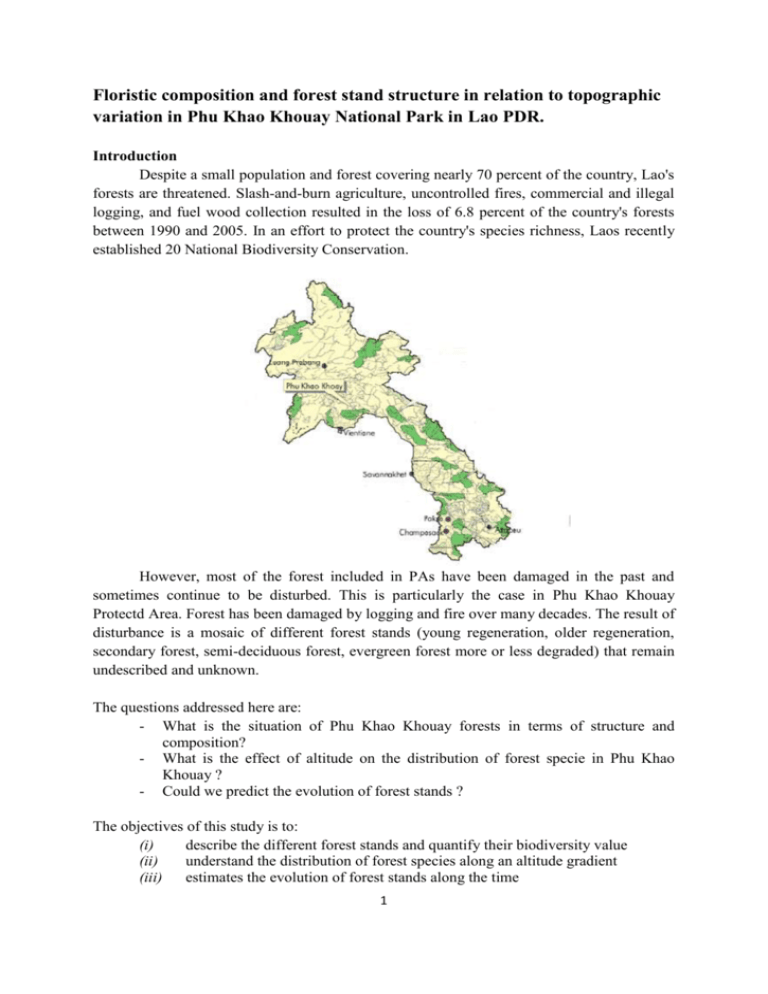
Floristic composition and forest stand structure in relation to topographic variation in Phu Khao Khouay National Park in Lao PDR. Introduction Despite a small population and forest covering nearly 70 percent of the country, Lao's forests are threatened. Slash-and-burn agriculture, uncontrolled fires, commercial and illegal logging, and fuel wood collection resulted in the loss of 6.8 percent of the country's forests between 1990 and 2005. In an effort to protect the country's species richness, Laos recently established 20 National Biodiversity Conservation. However, most of the forest included in PAs have been damaged in the past and sometimes continue to be disturbed. This is particularly the case in Phu Khao Khouay Protectd Area. Forest has been damaged by logging and fire over many decades. The result of disturbance is a mosaic of different forest stands (young regeneration, older regeneration, secondary forest, semi-deciduous forest, evergreen forest more or less degraded) that remain undescribed and unknown. The questions addressed here are: - What is the situation of Phu Khao Khouay forests in terms of structure and composition? - What is the effect of altitude on the distribution of forest specie in Phu Khao Khouay ? - Could we predict the evolution of forest stands ? The objectives of this study is to: (i) describe the different forest stands and quantify their biodiversity value (ii) understand the distribution of forest species along an altitude gradient (iii) estimates the evolution of forest stands along the time 1 Materials and methods + Study area Phu Khao Khouay National Park is an extensive sandstone mountain range 40 kilometres northeast of Vientiane. The area encompasses a variety of landscapes and habitats. The diversity of forest types in the area includes evergreen, mixed deciduous, dry dipterocarp and pine. In Phu Khao Khouay, forest stands have been studied in two places : Station 301 at 500 m altitude and Tad Xay at 300 m altitude. + Methods Sampling Sampling has been done by putting in place 0.25 ha permanent plots divided in 10 m square sub-plots (figure 2). In each sub-plot, trees (diameter >10 cm) were measured (dbh), geo-located labelled and identify. The identification is done using local name and material (leaves, flowers, fruits) is collected when possible. On each sub-plot corner, forest cover is estimated : figure 1 was attributed if vertically, over shrubs (height > 5 m), sky is visible ; figure 0 was given in all other cases. Sub plot 10m c Figure 1 : Plot design Specie richness 2 Observed specific richness (Sobs) is analysed by Hurlberg’s species richness curves. Hurlberg (1971) has modified Sanders (1968) method in order to estimate expected number of species in a sample of n individuals selected at random (without replacement) from a plot containing S species and N individuals. EstimateS software (Colwell, 2001) has been performed for calculation. Diversity - Shannon-Wiener index (H) A widely used measure of biological diversity is Shannon’s index. This index is also referred to as “Shannon’s information measure” or “entropy” (Shannon, 1948). It is defined by S H’ = - p log i i 1 2 ( pi ) pi = n/N with n = the total number of organisms of a particular species N = the total number of organisms of all species Equitability is an expression of the species distribution in a sample. E = H’/Hmax with H max log 2 S which represents maximal diversity - Simpson index (D) A first index D’ is calculated: S D' pi ² i 1 This index measures the probability that two individuals randomly selected from a sample will belong to the same species (Simpson, 1949). With this index, 0 represents infinite diversity and 1, no diversity. This is neither intuitive nor logical, so to get over this problem, D’ is subtracted from 1 to give D. D = 1- D’ Statistic analysis Multiple variable analysis was performed using R free software and in particular ADE4 module (R version 2.9, the R foundation for statistical computing). Non symetric correspondence analysis (NSCA) A non-symmetric correspondence analysis (NSCA) is used to establish a typology based on floristic composition of plots. Gimaret et al. (1999), believe NCSA is preferable because it 3 avoid over expression of rare species in the analysis. Based on this analysis, a cluster dendrogram, using Ward method, is performed to identify the different groups. Principal components analysis (PCA) Principal components analysis (PCA) has been used to establish typology of plots based on structural and soil parameters. In a same way as for NSCA, a distance matrix is calculated and the result is shown through a dendrogram. RESULTS 1. Sampling 10 plots of 0.25 ha have been set up in Phu Khao Khouay. 6 plots in Station 301 and 4 in Tad Xay. All trees have been measured and geolocated. 4 Figure 2 : Geolocalisation of trees in plot 1 2. Forest stand structure 2.1. Density Figure 3 :density of plots The density fluctuate from 304 (P07) to 564 (P02) and the average is 457. It depends on the age of the forest and the type of soil. For comparison, In Cat Tien National Park in Vietnam, 5 the density fluctuates from 195 to 540 trees/ha (Blanc et al., 2000). The average density in the pan tropical zone is 522. 2.2. Basal area Figure 4 :Basal area of plots Basal area values fluctuate from 20.97 (P07) to 45.12 (P09) and the average is 32 m2/ha in Phu Khao Khouay. Some forests appear like logged forest. For instance, the average basal area is 26 m²/ha in a logged forest in Vietnam. In Indonesia, basal area fluctuates from 37 to 44 m²/ha in an undisturbed forest (Trichon et al., 1998). At Pasoh in Malaysia, basal area is 37 m²/ha (Appanah et al., 1990). In India, Pascal and Pelissier (1996) found values close to 40 m²/ha in non exploited forest. 2.3. Diameter Figure 5 :Diameter classes of trees 6 Half of the trees are in the diameter class 10-20 cm and trees in diameter class ≥90 cm are rare. These are young forest stands. In a logged forest in Vietnam, the average percentage of trees with diameter < 20 cm is 63%. Figure 6 :Tree diameter value in plots The average diameter is 29.9 cm in P09 and 19.2 cm in P07. Some plots have no tree with diameter >60cm (P07) or very few trees (P04, P05, P08). 2.4. Height 7 Figure 7 :Tree height value in plots The average height is 18.4 m in P01 and 9.8 m in P07. Some plots have no tree higher than 20 m (P07, P08). 2.5. Typology of forest structure 8 Figure 8 : Dendrogram of plots based on structural characteristics 4 groups of structure can be identify : A. Forest with very low density (304 trees/ha) and very low basal area (21 m²/ha), no trees bigger than 60 cm, average height is 10m with no tree higher than 15m : P07 B. Forest with density (430-450 trees/ha) and low basal area (25-26 m²/ha), no trees bigger than 65 cm, average height is 14m with no tree higher than 25m : P4 and P8 C. Forest with density (410-560 trees/ha) and basal area (34-38 m²/ha), 6% tree bigger than 60cm, average height is 15-17m : P2, P3, P10 D. Forest with density (440-510 trees/ha) and basal area (41-45 m²/ha), 7 to 11% of trees are bigger than 60cm, average height is 16-18m and 33% trees are higher than 20m : P1, P9 3. Diversity and floristic composition 3.1. Specie richness 9 Figure 8 :specie richness in plots Specie richness is comprised between 22 in P09 and 44 in P01. The total number of specie is 117. 3.2. Diversity Index P01 P02 P03 P04 P05 P06 P07 P08 P09 P10 H 4.60 4.41 3.85 3.35 4.32 4.62 4.15 3.36 3.43 3.95 E 0.84 0.85 0.79 0.74 0.80 0.91 0.86 0.72 0.77 0.86 D 0.92 0.93 0.88 0.85 0.90 0.95 0.92 0.81 0.85 0.91 Values of diversity are ranged from 3.35 to 4.62 with Shannon index and equitability is comprised between 0.72 and 0.91. With the Simpson index, values are ranged from 0.81 to 0.95. By comparison, Simpson index can reach 0.97 (Newbery et al., 1992) and even 0,99 in Malaysian forests (GimaretCarpentier et al., 1998). Pascal and Pélissier (1996) and Guarrigues (1999) found diversity equivalent to 0.91 in Kharnataka –India. The diversity observed in Phu Khao Khouay is quite high. 3.3. Specie composition 10 Figure 9 :specie composition and dendrogram of plots We can identify 5 floristic composition : A. Dacrydium elatum and Pinus merkusii forest : P03 and P04 B. Hydnocarpus ilicifolia and Hopea ferrea forest : P08 C. Cynometra craibii forest: P07 D. Uvaria cordata forest: P05 and P06 E. Hopea sp forest : P01, P02, P09, P10 3.4. Effect of altitude on specie distribution An ANOVA has been performed on the contingency table to identify effect of altitude. The results are show below for positive effect : Cinnamomum sp2 occurs mainly at low altitude (300m) : Df Sum Sq Mean Sq F value Pr(>F) altit 1 1.32176 1.32176 13.587 0.006165 ** Residuals 8 0.77824 0.09728 Garcinia oliveri occurs mainly at high altitude (500m) : Df Sum Sq Mean Sq F value Pr(>F) altit 1 0.97519 0.97519 5.4755 0.04742 * Residuals 8 1.42481 0.17810 Quercus sp1 occurs mainly at high altitude (500m) : Df Sum Sq Mean Sq F value Pr(>F) altit 1 20.316 20.316 4.4427 0.06811 . Residuals 8 36.584 4.573 11 Spp116 occurs mainly at high altitude (500m) : Df Sum Sq Mean Sq F value Pr(>F) altit 1 0.74090 0.74090 4.3611 0.0702 . Residuals 8 1.35910 0.16989 Project coordinator’s signature : 12


