Folie mit WIFO-Logo - of Prof Karl Aiginger
advertisement
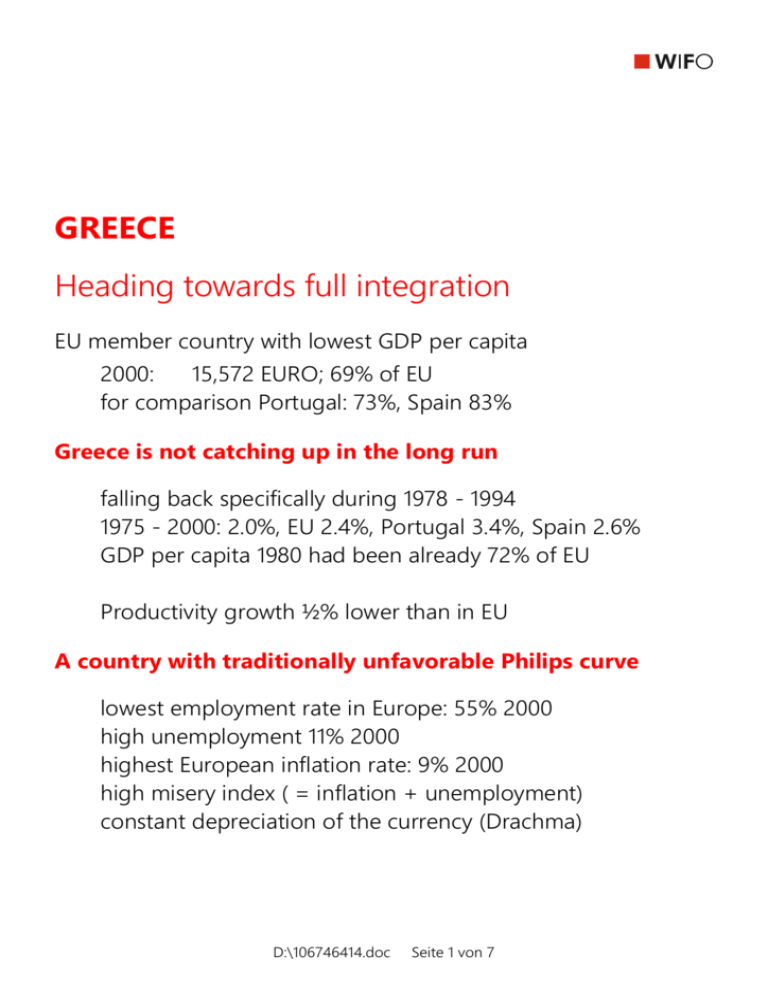
GREECE Heading towards full integration EU member country with lowest GDP per capita 2000: 15,572 EURO; 69% of EU for comparison Portugal: 73%, Spain 83% Greece is not catching up in the long run falling back specifically during 1978 - 1994 1975 - 2000: 2.0%, EU 2.4%, Portugal 3.4%, Spain 2.6% GDP per capita 1980 had been already 72% of EU Productivity growth ½% lower than in EU A country with traditionally unfavorable Philips curve lowest employment rate in Europe: 55% 2000 high unemployment 11% 2000 highest European inflation rate: 9% 2000 high misery index ( = inflation + unemployment) constant depreciation of the currency (Drachma) D:\106746414.doc Seite 1 von 7 Regaining growth and stability in the nineties Despite of specific hard environment New competition from the accession countries Balkan wars increase “economic distance” EU defines Maastricht criteria as condition for EURO EU pressure facilitates economic discipline Above EU growth 1995 – 2001 striving for economic stability fulfilling Maastricht criteria and finally becoming success and surprise: member of the Monetary Union 2002 productivity growth slower than in EU Economic level in accession countries quite near or higher Slovenia lags only by about 10% in GDP per capita at PPP to EU Larger difference but catching up: Hungary, Bulgaria, Romania D:\106746414.doc Seite 2 von 7 Manufacturing Low share, low growth in output, productivity catching up 2nd lowest share of GDP in EU (10% GR, EU 18% ) ½% of EU output originates in Greece, 3% of population) Growth 75-1990 less than in Europe , higher in nineties Higher productivity growth due to competitive pressure Instead of spreading employment across workers Work force remains in agriculture Or switch to tourism Unfavorable structure, large discontinuous changes High share of labor intensive industries (still increasing) and food Highest structural change in manufacturing But not active and voluntary First enclave type capital intensive industries came under pressure by increasing “economic” distance to Europe then labor intensive textiles came under pressure from eastern reform countries Textiles one forth of production and exports Capital intensive industries in tobacco, boats, petroleum, cement and ferrous metals Largest firms: Hellenic Telekom, National Bank of Greece Coca Cola Hellenic, EFG Eurobank, Alpha Bank D:\106746414.doc Seite 3 von 7 Costs and productivity Productivity spread Slow growth in domestic oriented sector like food and apparel fast growth in capital intensive sectors Costs: Wages and productivity in manufacturing Catching up, now 50% of EU average Taxes to GDP rising from 35% to 48% 1990 – 2000 Government expenditures explodes from 1980 - 1990 30% of GDP to 50% Fiscal deficit: from 10% of GDP to 0% in 2000 FDI position: 11% of GDP D:\106746414.doc Seite 4 von 7 Growth drivers Last position in R&D share Lagging in innovation and ICT Exemption: Telecom expenditures Liberalization and low telecom prices Relative high share of tertiary education (universities) But nor well connected to economy Insufficient training High unskilled school dropouts Low innovation in small and medium firms Investment ratio less than EU average Relative high market capitalization Open tendering D:\106746414.doc Seite 5 von 7 Greece is EU member with important external interests Politically: Turkey, Cyprus Economically 50% of exports are extra EU exports Extra exports grow faster Intra exports grow slower High and growing shares with Cyprus, Bulgaria, Macedonia and Turkey But also Russia, Bulgaria, Romania One of the most open economies (export + import) High trade deficit D:\106746414.doc Seite 6 von 7 Overall assessment A laggard not catching up in a persistent process Small industrial basis: from agriculture to services ? Unsuccessful investment in capital intensive industries Of a labor abundant country Specialization in labor intensive industries are contested from new low cost countries Non strategic economic development policy over decades Permissive macro policy: high inflation, unemployment, devaluations Increasing “economic” and political distance from EU in the nineties Application of EU rules lead to for self discipline in the nineties Successful years of consolidation plus growth in the nineties Major success: entry into the Monetary Union in 2002 D:\106746414.doc Seite 7 von 7

