In-Class Exercise: Understanding Climate Model
advertisement
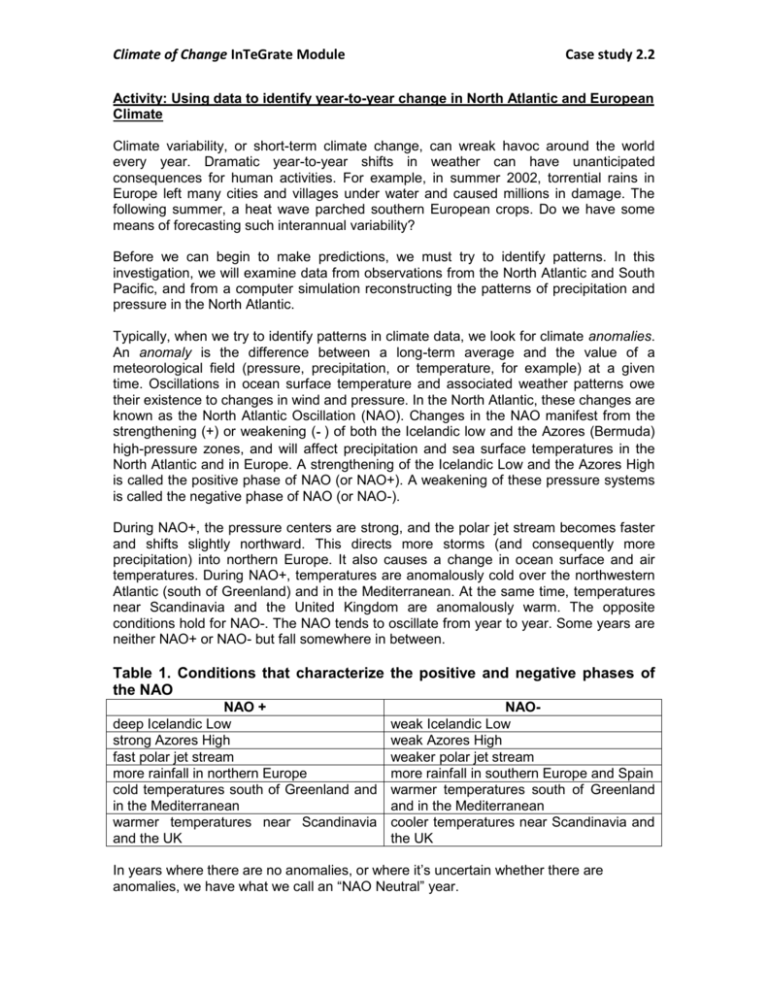
Climate of Change InTeGrate Module Case study 2.2 Activity: Using data to identify year-to-year change in North Atlantic and European Climate Climate variability, or short-term climate change, can wreak havoc around the world every year. Dramatic year-to-year shifts in weather can have unanticipated consequences for human activities. For example, in summer 2002, torrential rains in Europe left many cities and villages under water and caused millions in damage. The following summer, a heat wave parched southern European crops. Do we have some means of forecasting such interannual variability? Before we can begin to make predictions, we must try to identify patterns. In this investigation, we will examine data from observations from the North Atlantic and South Pacific, and from a computer simulation reconstructing the patterns of precipitation and pressure in the North Atlantic. Typically, when we try to identify patterns in climate data, we look for climate anomalies. An anomaly is the difference between a long-term average and the value of a meteorological field (pressure, precipitation, or temperature, for example) at a given time. Oscillations in ocean surface temperature and associated weather patterns owe their existence to changes in wind and pressure. In the North Atlantic, these changes are known as the North Atlantic Oscillation (NAO). Changes in the NAO manifest from the strengthening (+) or weakening (‐ ) of both the Icelandic low and the Azores (Bermuda) high-pressure zones, and will affect precipitation and sea surface temperatures in the North Atlantic and in Europe. A strengthening of the Icelandic Low and the Azores High is called the positive phase of NAO (or NAO+). A weakening of these pressure systems is called the negative phase of NAO (or NAO-). During NAO+, the pressure centers are strong, and the polar jet stream becomes faster and shifts slightly northward. This directs more storms (and consequently more precipitation) into northern Europe. It also causes a change in ocean surface and air temperatures. During NAO+, temperatures are anomalously cold over the northwestern Atlantic (south of Greenland) and in the Mediterranean. At the same time, temperatures near Scandinavia and the United Kingdom are anomalously warm. The opposite conditions hold for NAO-. The NAO tends to oscillate from year to year. Some years are neither NAO+ or NAO- but fall somewhere in between. Table 1. Conditions that characterize the positive and negative phases of the NAO NAO + deep Icelandic Low strong Azores High fast polar jet stream more rainfall in northern Europe cold temperatures south of Greenland and in the Mediterranean warmer temperatures near Scandinavia and the UK NAOweak Icelandic Low weak Azores High weaker polar jet stream more rainfall in southern Europe and Spain warmer temperatures south of Greenland and in the Mediterranean cooler temperatures near Scandinavia and the UK In years where there are no anomalies, or where it’s uncertain whether there are anomalies, we have what we call an “NAO Neutral” year. Climate of Change InTeGrate Module Case study 2.2 Goals: (1) Identify patterns of climate change in the North Atlantic and Europe. (2) Gain experience interpreting climate data. Directions: The PowerPoint slides also contain three sets of data (precipitation, pressure, and sea surface temperature anomalies). Take some time to orient yourself to the maps and the data, then answer the questions below. Precipitation You have 10 years of precipitation rate anomaly estimates from the North Atlantic (1993–2003). For each year, you have a plot of anomalies (in mm/day) averaged over the months of December, January, and February (DJF). 1) Why is it important to look at the precipitation anomalies, and not just at the actual precipitation rate? 2) On slide 4, in 1993–94, where do you find the largest negative anomaly? (Specify roughly with a range of latitude and longitude or a geographical area—you do not need to be super precise!) How large is the anomaly here (in mm/day)? Scroll through the ten years of images; notice especially what happens in the plots of anomalies. 3) During which 4 years, and in which areas during these years, do you find the largest positive anomalies (look for values > 4 mm/day that spread over the largest areas)? 4) During which 4 years, and in which areas during these years, do you find the largest negative anomalies (look for values < -2 mm/day that spread over the largest areas)? Climate of Change InTeGrate Module Case study 2.2 5) Now, focus on the western half of the Iberian Peninsula (Portugal and Western Spain). Scroll through the anomaly plots, and for each year, mark the greatest precipitation anomaly you find on the table below. Precipitation 1993– 1994– 1995– 1996– 1997– 1998– 1999– 2000– 2001– 2002– Anomaly 94 95 96 97 98 99 2000 2001 02 03 6 5 4 3 2 1 0 -1 -2 Pressure Anomalies You have 10 years (1994–2003) of surface pressure anomaly estimates from the North Atlantic. These estimates (in mb) have been averaged over the months of December, January, and February (DJF). 6) In 1993–94, where do you find the largest positive pressure anomaly in the Atlantic Ocean (ignore anomalies over Scandinavia or Russia)? (Specify with a range of latitude and longitude or a general geographic location.) Scroll through the ten years of images; notice what happens to the positive and negative anomalies. 7) On the blank map below, create a plot showing the location of the largest positive pressure anomaly each year in the Atlantic Ocean. For example, in the 1993–4 pressure anomaly plot, there is a large anomaly of positive pressure near the Azores. Place the first X on the map in the approximate center of this region and label it “93–94.” In 1994– 95, the positive anomaly is located over southwestern Spain, so place an X in this region. Complete the map for the remaining 8 years, connecting the X’s as you go. If it’s not clear where to place the center of the anomalous high, you may skip that year. (This will get a little messy, that’s OK!) Climate of Change InTeGrate Module Case study 2.2 8) Now do the same as in (7), but for the low-pressure anomalies. 9) List below the two years in which the Iberian Peninsula (Spain and Portugal) had the highest anomalous precipitation (see your table in number5). At approximately what latitude do you find the center of the high-pressure anomaly during each of these years? Climate of Change InTeGrate Module Case study 2.2 10) During each of the years with the highest precipitation anomalies on the Iberian Peninsula, at what latitudes do you find the anomalous low-pressure centers? 11) Can you draw any conclusions about the location of the anomalous high or low pressures and precipitation on the Iberian Peninsula? Would you consider the years of highest precipitation on the Iberian Peninsula NAO+ or NAO-? Explain your answer. 12) Hypothesize a physical mechanism that might explain a connection between anomalous pressure and precipitation. How does pressure affect precipitation?
