Biodiversity_Samplin..
advertisement

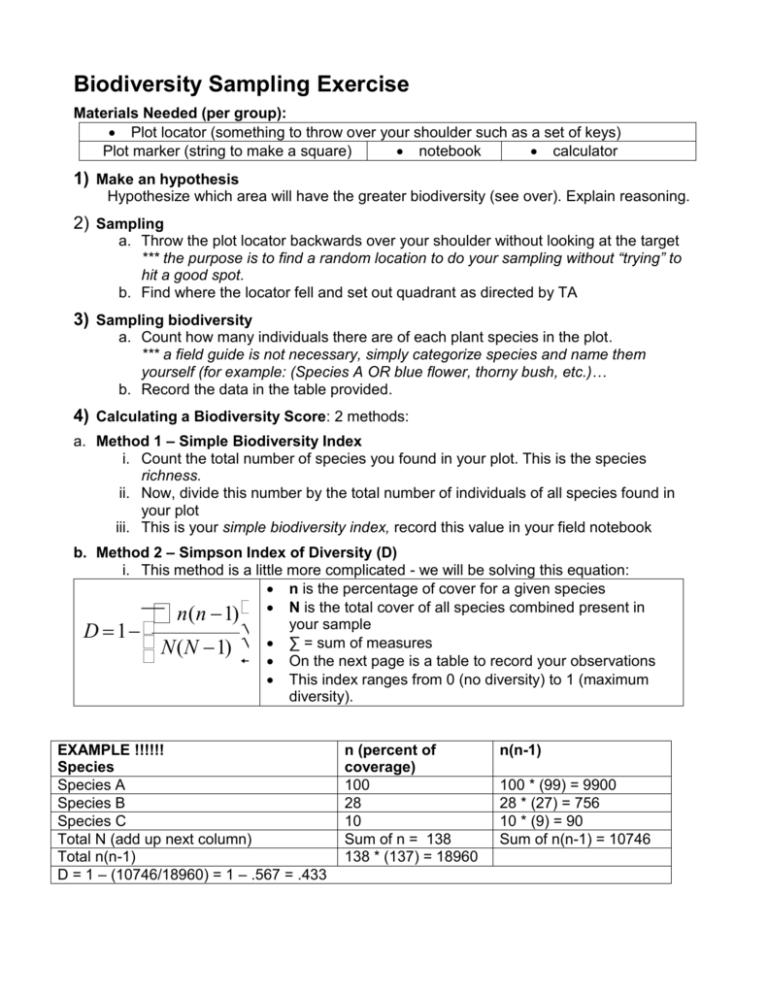
Biodiversity Sampling Exercise Materials Needed (per group): Plot locator (something to throw over your shoulder such as a set of keys) Plot marker (string to make a square) notebook calculator 1) Make an hypothesis Hypothesize which area will have the greater biodiversity (see over). Explain reasoning. 2) Sampling a. Throw the plot locator backwards over your shoulder without looking at the target *** the purpose is to find a random location to do your sampling without “trying” to hit a good spot. b. Find where the locator fell and set out quadrant as directed by TA 3) Sampling biodiversity a. Count how many individuals there are of each plant species in the plot. *** a field guide is not necessary, simply categorize species and name them yourself (for example: (Species A OR blue flower, thorny bush, etc.)… b. Record the data in the table provided. 4) Calculating a Biodiversity Score: 2 methods: a. Method 1 – Simple Biodiversity Index i. Count the total number of species you found in your plot. This is the species richness. ii. Now, divide this number by the total number of individuals of all species found in your plot iii. This is your simple biodiversity index, record this value in your field notebook b. Method 2 – Simpson Index of Diversity (D) i. This method is a little more complicated - we will be solving this equation: n is the percentage of cover for a given species æ n(n -1) ö N is the total cover of all species combined present in your sample ÷ D = 1- ç ç N(N -1) ÷ ∑ = sum of measures è ø On the next page is a table to record your observations This index ranges from 0 (no diversity) to 1 (maximum diversity). å EXAMPLE !!!!!! Species Species A Species B Species C Total N (add up next column) Total n(n-1) D = 1 – (10746/18960) = 1 – .567 = .433 n (percent of coverage) 100 28 10 Sum of n = 138 138 * (137) = 18960 n(n-1) 100 * (99) = 9900 28 * (27) = 756 10 * (9) = 90 Sum of n(n-1) = 10746 Hypothesis: ****DATA COLLECTION TABLE******* Species Percent Coverage by quadrant Avg. Cover n(n-1): for each Q1–Q4 species, multiply Q1 Q2 Q3 Q4 avg. cover (n) * (n-1) Species A Species B Species C Species D Species E Species F Species G Species H Species I Species J TOTAL Sum totals from species avg. cover Q1-Q4, This = N THEN multiply N * (N – 1) N * (N – 1) = Sum n(n-1) from rows above = Simpson Diversity Index = D = 1 – [n * (n – 1) / N * (N – 1)] = Discussion: Comparing plots a. Share your data with other groups and calculate an average biodiversity index b. How do the ‘basic’ and the ‘Simpson’ biodiversity indices compare? c. Answer provided discussion questions


