algae/Co2
advertisement
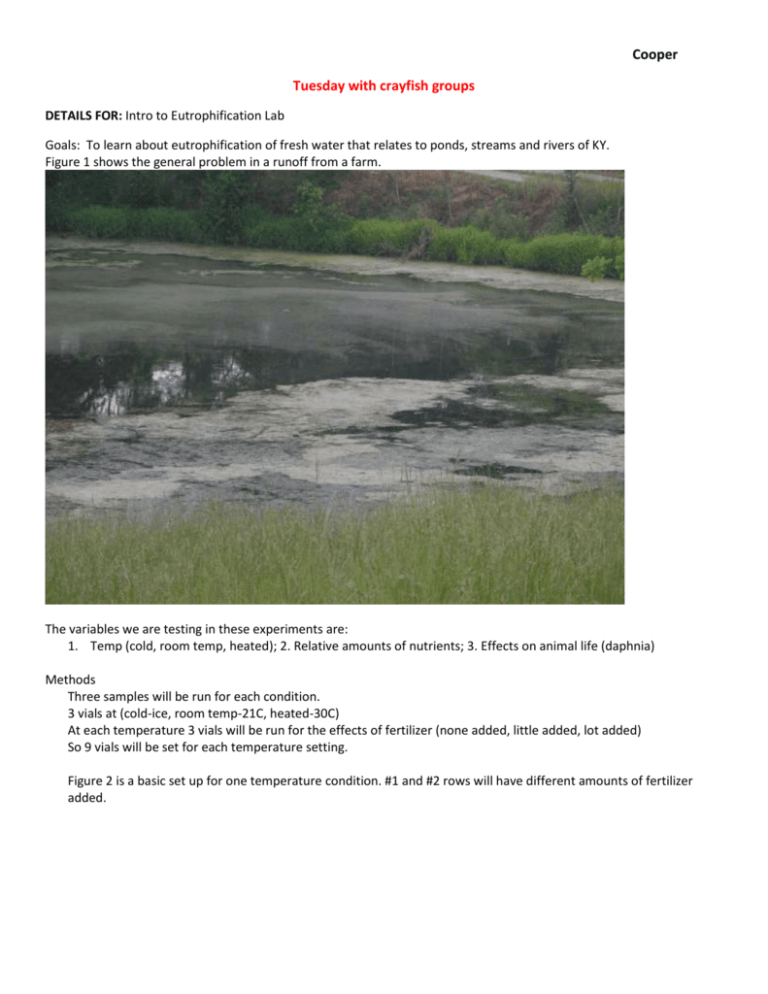
Cooper Tuesday with crayfish groups DETAILS FOR: Intro to Eutrophification Lab Goals: To learn about eutrophification of fresh water that relates to ponds, streams and rivers of KY. Figure 1 shows the general problem in a runoff from a farm. The variables we are testing in these experiments are: 1. Temp (cold, room temp, heated); 2. Relative amounts of nutrients; 3. Effects on animal life (daphnia) Methods Three samples will be run for each condition. 3 vials at (cold-ice, room temp-21C, heated-30C) At each temperature 3 vials will be run for the effects of fertilizer (none added, little added, lot added) So 9 vials will be set for each temperature setting. Figure 2 is a basic set up for one temperature condition. #1 and #2 rows will have different amounts of fertilizer added. In figure 3 we see the three conditions for temperature and the level of fertilization. The brine shrimp farm is for use if testing survival of the shrimp at each eutrophification level. The glass vials are pushed into cut outs of Styrofoam so that the vials will float in the water bath and ice bath when the ice melts (Figure 4). Also these vials are used for measuring light intensity that passes through the vial as a measure of algae growth. The bottoms of the vials are as low as possible in order to maximize contact with the water or ice in the baths. If the holes in the Styrofoam are too large one can place rubber band around the vials to help keep the vials from falling through the holes. In these experiments we used a common fertilizer Miracle-Gro. Different concentrations of Miracal-Gro can be used according for a class. In our experiments we filled the vials 50% with water that had algae starting to grow from a stock culture and 50% of water from a bottle of Spring Water (drinking water without chlorine). Stock bottle and algae culture is shown in Figure 5. Light is used as light source but also for heat. An aeration stone is placed in the bottom of glass jar... A simple fish tank aeration pump is used. Day 1: Place vials in appropriate groups and measure turbidity of the water with light probe 1. Measure turbidity: Vernier LabPro (Vernier Software & Technology, 13979 SW Millikan Way, Beaverton, OR, 97005-2886, USA) connected to laptop. Use Logger Pro3 software. Use a defined chamber for providing the same amount of light to each vial. Control for background lighting. The detector also needs to be in a set position for each measurement. We will use a Styrofoam chamber made specifically for this purpose (Figure 6 set.). Side view: Water at ½ level to be measured. Glass tight against meter and light source. Top view of chamber. Light source is a small pocket flash light and to diffuse the light a piece of tissue paper is tapped over the end and a few layers of tape as well to dampen the light intensity. Styrofoam chamber with cut outs to hold light and meter (shown from top view). Collect data points for 10 sec and obtain average reading on stats menu. Record data in notebook. Go to next sample. (NOTE: try not to move light source or meter when switching vials). Write down value for all 9 vials in each of the three groups (18 vials in all). Set the vials in the Styrofoam holders and place in appropriate environments. 2. Set up Brine Shrimp farm for latter in the week. This will be a demo for the class. Buy eggs from pet store and follow directions. Measure turbidity: Use Logger Pro3 software. Use a defined chamber for providing the same amount of light to each vial. Control for background lighting. The detector also needs to be in a set position for each measurement. We will use a Styrofoam chamber made specifically for this purpose (Figure 6 series). Collect data points using an average. Write down value for all 9 vials in each of the three groups (18 vials in all). Set the vials in the Styrofoam holders and place in appropriate environments. Tuesday Afternoon CO2 effects on pH of water (fresh and salt water) Goals: (1) To learn about dissolved CO2 in fresh water as compared to salt water and the effect of CO2 on pH in the water. (2) Effects on animal life with CO2 being dissolved in the bodies of water. The variables we are testing in these experiments are: 1. Type of water (fresh and salt); 2. Temperature of the water (room temp vs. ice cold water) 3. Effects on animal life (daphnia or crayfish for fresh water only). 2. See movie made in the lab on set up for crayfish and CO2 exposure. Record data ourselves repeating these experiments. WEDNESDAY Measure turbidity for the Eutrophification experiments. Use Logger Pro3 software. Use a defined chamber for providing the same amount of light to each vial. Control for background lighting. The detector also needs to be in a set position for each measurement. We will use a Styrofoam chamber made specifically for this purpose (Figure 6 series). Collect data points using an average. Write down value for all 9 vials in each of the three groups (18 vials in all). Set the vials in the Styrofoam holders and place in appropriate environments. Collect data points using an average. Write down value for all 9 vials in each of the three groups (18 vials in all). Plot out data in Excel. Average the 3 samples for each day and plot the average value for each day for each condition.. One could make 3 graphs for each temperature and within each graph plot the effect in the difference from control to the vials with different amounts of Miracle-gro. One could also plot the raw values for set of vials (control, low and high fertilizer). Sample graphs: ? Ice bath ? Room temp ? 30 C water bath BRINE SHRIMP ASSAY: Take 5 mls of solutions (previously prepared by instructor, but in a classroom could be samples ran in parallel to the eutrophification set up or same water samples from the eutrophification experiments after experiments are completed) and put on plastic Petri dish. Add Brine Shrimp to each of 3 samples from each temperature. Let them sit for 30 minutes and see of Brine Shrimp are altered in their degree of swimming behavior. (Note: Brine shrimp movements are light dependent so examine them is the same lighting conditions. Make sure all water sample are at room temperature before adding Brine Shrimp) Take notes for rapidity of swimming behavior and the number of shrimp moving. Effect of pH and CO2 on animal behavior Drosophila larvae and adults set-up—demo o Under microscopes Crayfish behavior o Build on past experiments/pH levels/freshwater and treated o Sensory, heart rate, social interaction Watch adult fruit flies pass out with CO2 to compare with crayfish studies. Use plastic vial with foam stopper- Use 5 grams of baking soda and 10 mls of vinegar as in earlier experiments. Ask- why do adult flies pass out? Well what happens to them after 10 minutes of being exposed to air? What type of mechanism can cause this physiological phenomena? Let’s examine larval Drosophila.
