Electronic supplementary material
advertisement
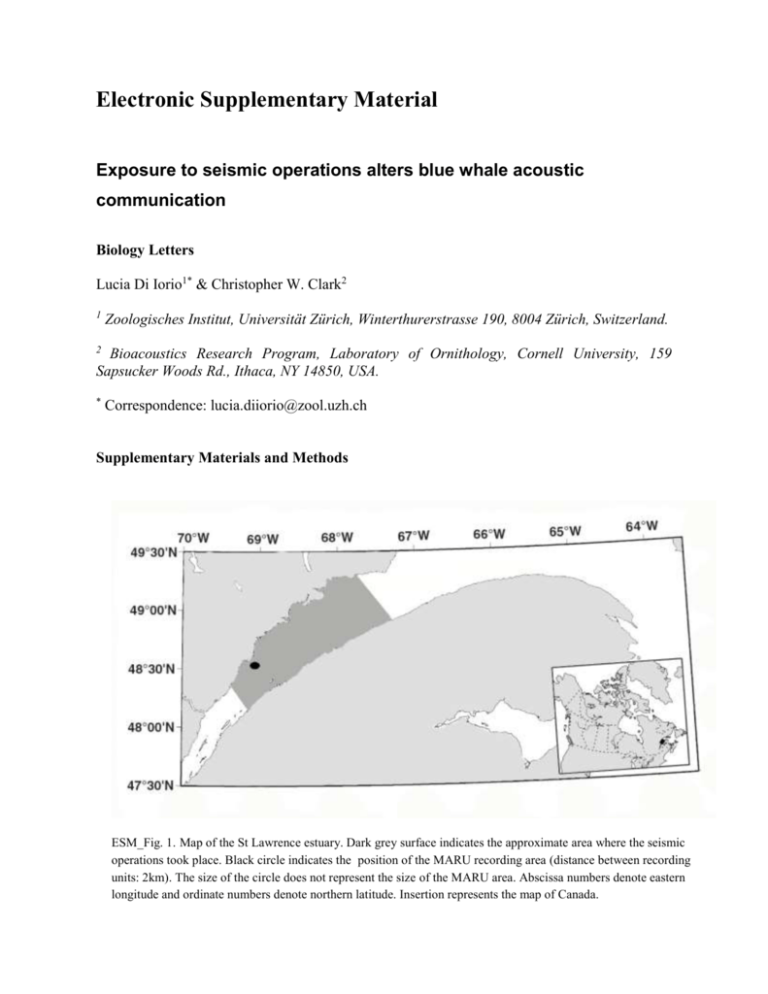
Electronic Supplementary Material Exposure to seismic operations alters blue whale acoustic communication Biology Letters Lucia Di Iorio1* & Christopher W. Clark2 1 Zoologisches Institut, Universität Zürich, Winterthurerstrasse 190, 8004 Zürich, Switzerland. 2 Bioacoustics Research Program, Laboratory of Ornithology, Cornell University, 159 Sapsucker Woods Rd., Ithaca, NY 14850, USA. * Correspondence: lucia.diiorio@zool.uzh.ch Supplementary Materials and Methods ESM_Fig. 1. Map of the St Lawrence estuary. Dark grey surface indicates the approximate area where the seismic operations took place. Black circle indicates the position of the MARU recording area (distance between recording units: 2km). The size of the circle does not represent the size of the MARU area. Abscissa numbers denote eastern longitude and ordinate numbers denote northern latitude. Insertion represents the map of Canada. ESM_Table 1. Summary of the sparker noise impinging on the recording units during the seismic survey and of the resulting days selected for the analyses (‘seismic’, ‘no-seismic’). Survey day 1 2 3 4 5 6 7 8 9 10 11 Sparker pulses n y y y y/n n n n y/n y n Analyses no-seismic seismic seismic seismic no-seismic no-seismic no-seismic seismic - y= sparker pulses clearly recorded on all MARUs; n=no or only barely detectable sparker noise; y/n: sparker noise not detectable on all recording units; dash indicating days not included in the analyses: on day 11 no visual observations were conducted necessary to determine the number of whales present Supplementary Results ESM_Table 2. Results from the Wald-Wolfowitz Runs tests performed to test for the independence of the daily 10min samples (N) used for call production analysis. Survey day N Z P 1 2 3 4 6 7 8 10 36 18 25 31 34 24 35 43 -1.44 -1.05 0.29 -0.98 -0.47 -1.74 -0.60 -1.55 0.15 0.3 0.8 0.33 0.64 0.08 0.55 0.12
