Sidescan Sonar - traktoria.org
advertisement
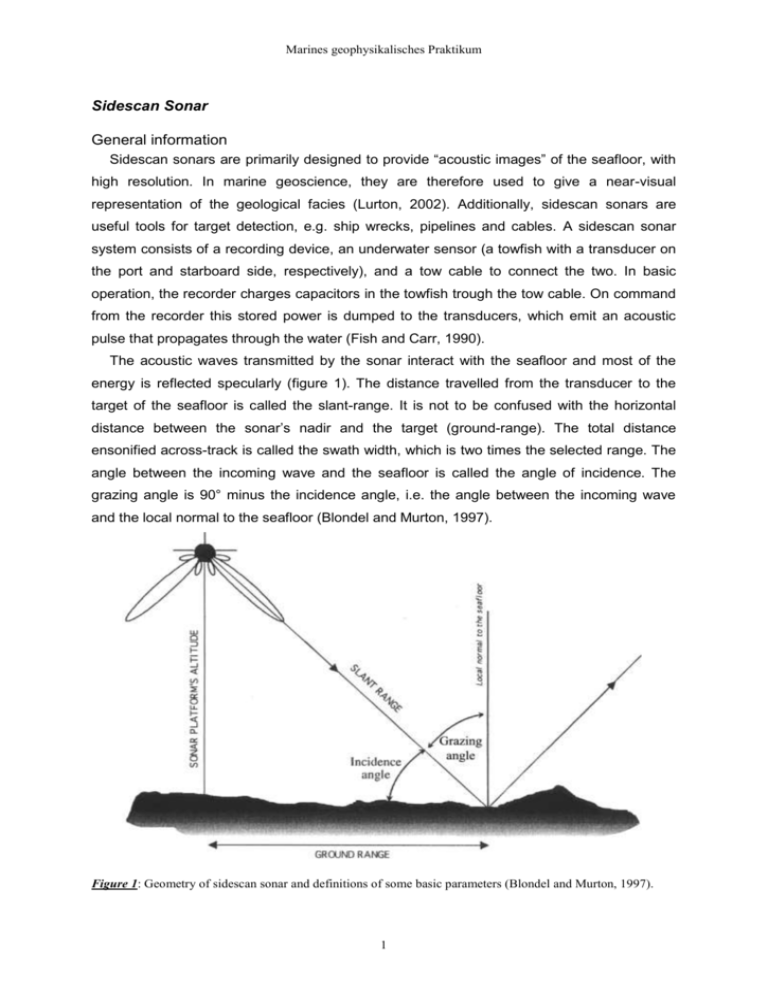
Marines geophysikalisches Praktikum Sidescan Sonar General information Sidescan sonars are primarily designed to provide “acoustic images” of the seafloor, with high resolution. In marine geoscience, they are therefore used to give a near-visual representation of the geological facies (Lurton, 2002). Additionally, sidescan sonars are useful tools for target detection, e.g. ship wrecks, pipelines and cables. A sidescan sonar system consists of a recording device, an underwater sensor (a towfish with a transducer on the port and starboard side, respectively), and a tow cable to connect the two. In basic operation, the recorder charges capacitors in the towfish trough the tow cable. On command from the recorder this stored power is dumped to the transducers, which emit an acoustic pulse that propagates through the water (Fish and Carr, 1990). The acoustic waves transmitted by the sonar interact with the seafloor and most of the energy is reflected specularly (figure 1). The distance travelled from the transducer to the target of the seafloor is called the slant-range. It is not to be confused with the horizontal distance between the sonar’s nadir and the target (ground-range). The total distance ensonified across-track is called the swath width, which is two times the selected range. The angle between the incoming wave and the seafloor is called the angle of incidence. The grazing angle is 90° minus the incidence angle, i.e. the angle between the incoming wave and the local normal to the seafloor (Blondel and Murton, 1997). Figure 1: Geometry of sidescan sonar and definitions of some basic parameters (Blondel and Murton, 1997). 1 Marines geophysikalisches Praktikum The returning echoes from the seafloor are received by the transducers over a very short period of time (in the range of milliseconds), amplified, and transmitted up the tow cable to the recorder. The recorder further processes these signals, digitizes them, calculates the proper position for them in the record, pixel by pixel, and then prints these echoes on thermal paper, one scan at a time (Fish and Carr, 1990). In recent years, with the advent of digital data acquisition systems, recording on paper has become obsolete. Instead, data are stored digitally and can be used for further data processing. Beam pattern In a "typical" side scan sonar system, the beam is narrow in the horizontal plane and broad in the vertical plane (figure 2). In a typical 100 kHz system this would be 1° in the horizontal and 40° in the vertical and for a 500 kHz system 0.2° in the horizontal and 40° in the vertical. The main axis of the beam is typically angled 10-20° down from the horizontal, so that most of the energy is directed toward the sea floor where it is needed. Figure 2: Typical beam pattern of a sidescan sonar having a narrow beamwidth in the horizontal and a broad beamwidth in the vertical plane. The narrow beamwidth is not only necessary for achieving a sharp image of the seafloor, but it helps in rejecting noise from extraneous sources. In the ocean, noise will be reaching the sonar from all directions but the response to all this disturbance will be controlled by the 2 Marines geophysikalisches Praktikum beam pattern. Thus most of the noise will be rejected, improving the sonar performance (Mazel, 1985). Resolution The outgoing pulses of a sidescan sonar have a specific pulse length (in milliseconds) and the thickness of the pulse is the product of pulse length and sound velocity in water (figure 3). A short pulse will have better resolution (see below), while a longer pulse would be less sensitive to noise, resulting in improved range performance (Mazel, 1985). Typical pulselengths are 0.1 ms (100 kHz) and 0.02 ms (500 kHz). Figure 3: Thickness of a sonar pulse as the product of pulse length and sound velocity (Mazel, 1985). The outgoing three-dimensional pulse will interact with the seafloor. The region ensonified by an outgoing pulse during one instant is called the sonar’s footprint. The size and form of the footprint on the seafloor depends on the across-track distance from the sonar. It determines the resolution1 of a sonar system. The footprint is longer near the sonar due to the angle of incidence. The across-track resolution is related to the cosine of this angle which is equal to the sine of the grazing angle . y c T 2 sin (1) where c is the sound velocity in water and T is the pulse length (Lurton, 2002). The greater the distance from the sonar, the more the footprint approaches the actual pulse length in the 1 Resolution is the ability to distinguish between two distinct objects. 3 Marines geophysikalisches Praktikum water (figure 4). The implication is that across-track resolution is better further away from the sonar (Mazel, 1985). Figure 4: The across-track resolution of a sonar increases with range (Mazel, 1985). Equation 1 is only a nevertheless useful approximation of the real world. When 0, this approximate solution is not valid (y), and the resolution becomes: y h c T (2) with h being the sonar’s altitude above the seafloor (Lurton, 2002). Resolution in the along-track direction will be strongly dependent on the sonar’s horizontal beamwidth. The beam widens with increasing distance from the towfish (beam spreading). Near the towfish, where beam spreading is not significant, two objects are clearly delineated as separate objects (figure 5). However, as the beam spreads out into the far region, the areas of ensonification widen. In these cases two separate objects on the seafloor may be imaged by the same sonar beam, thus appearing as one single object in the resulting sonar data (Fish and Carr, 1990). The along-track resolution can be estimated by (Flemming, 1976): x r sin (3) where r is the distance in across-track direction and is the horizontal beamwidth. 4 Marines geophysikalisches Praktikum Figure 5: The along-track resolution is dependent on beam spreading and therefore best near the sonar (Mazel, 1985). In summary the resolution of a sidescan sonar is on the one hand inhomogeneous, both across-track and along track, and on the other hand varying along the ensonified swath (figure 6): At small distances y>>x, across-track resolution is the worst, whereas along-track resolution is best. At large distances, y<<x, across-track resolution is best, whereas along-track resolution is bad (Lurton, 2002). Figure 6: Evolution of the horizontal resolution of a sidescan sonar (Lurton, 2002). Another performance constraint of a sidescan sonar is the need to ensure complete coverage of the ensonified area. The condition that needs to be fulfilled is the removal of gaps between ensonified areas from two successive pings (Lurton, 2002). Complete coverage depends on transducer length L, vessel speed v and ping rate fp, which can be calculated by sound velocity in water and the selected range R: 5 Marines geophysikalisches Praktikum fp c 2 R (4) With given transducer length L (approximately 40 cm for the used Klein and EG&G towfishes) and ping rate (determined by the selected range), complete coverage is achieved when a maximum vessel speed vmax is not exceeded: vmax L f p Lc 2 R (5) Backscatter Most of the energy arriving at the seafloor is scattered forward in the specular direction. A small portion is lost in the ground, and a small portion (several orders of magnitude smaller than the incident wave) is scattered back to the sonar. The backscattering is affected, in decreasing order of importance, by (Blondel and Murton, 1997): the geometry of the sonar-target system (angle of incidence of each beam, local slope, etc.) the physical characteristics of the surface (e.g. micro-scale roughness) the intrinsic nature of the surface (composition, density, relative importance of volume vs. surface diffusion for the selected frequency) Figure 7: Relationship between mean grain size versus relative backscatter strength: a) based on data from the inner shelf of the Gulf of Mexico (Davis et al, 1996), b) based on data from the shelf of the New Jersey margin (Goff et al., 2000). 6 Marines geophysikalisches Praktikum In the absence of large topographic variations, it is generally assumed that, in case of unconsolidated sediments, the grain size is the dominant factor in affecting the backscatter strength. Coarse sediments principally cause a higher backscatter than fine sediments do, as was shown by Davis et al. (1996) for sandy sediments (figure 7a). Nevertheless, backscatter is disproportionately affected by larger grain sizes. Addition of a few extra weight percentage of larger grain sizes (>4 mm) can strongly degrade the correlation (Goff et al. 2000; figure 7b). Distortions Sidescan sonar data becomes distorted during generation. These distortions are caused by towfish instabilities (figure 8), speed variations in the survey vessel, and range data compression due to towfish altitude (slant-range distortion). Towfish instabilities are minimised by the towing configuration used by the Institute of Geosciences, Kiel University. Speed variations and slant-range distortions can be corrected by digital sidescan sonar systems (Fish and Carr, 1990). Speed correction can be done online during data acquisition by applying the calculated ship speed from GPS-data. Figure 8: Towfish instabilities, which degrade the quality of the sonar data (Fish and Carr, 1990). Raw sidescan sonar imagery presents important across-track geometric distortions (slantrange distortion). They occur because the sonar system actually measures the time for a transmitted pulse to travel from the transducer to the target and the same way back. Figure 9 shows the slant-range distortion: two targets close to the nadir (A and B) will be associated with nearly identical slant-ranges R1=cT1 and R2=cT2. Conversely, two targets at far range (C 7 Marines geophysikalisches Praktikum and D), at the same distance from one another, will be associated with very different slantranges R3=cT3 and R4=cT4 and therefore placed further apart. Without slant-range correction, near-range areas are more compressed than far-range areas. Slant-range correction is a remapping of pixels from their apparent position to the true one and is computed from the elapsed time and the sonar’s altitude. Assuming a flat seafloor, the correct distance on the ground is: Di Ri2 h 2 (6) where RI is the slant-range distance and h is the sonar’s altitude (Blondel and Murton, 1997). Figure 9: Slant-range distortion (Fish and Carr, 1990). For further explanations see text. Slant-range correction assumes a flat seafloor across-track, thus errors are introduced, if the true topography significantly deviates from flat-bed conditions. Moreover, a reasonable bottom-tracking is necessary to precisely calculate the slant-range correction. Bottomtracking is the attempt to depict the first return from the seafloor, which yields the altitude of the towfish above the seafloor. Several methods of bottom-tracking are available: Amplitude: Isis recording software looks for the user selected percentage (level) of the total voltage range. Isis won’t start looking until after the holdoff value. Gradient: Isis looks for where the voltage levels have the greatest change in gradient, after the holdoff value. Manual: User inputs a static value. 8 Marines geophysikalisches Praktikum The record Figure 10 displays a typical representation of digitally recorded sonar data using the Isis software from Triton-Elics Int. Figure 10: Typical display of recorded sonar data. Processing The digitally recorded data will be processed after a survey. This contains several steps termed pre-processing, processing per se, and post-processing (Blondel and Murton, 1997). Pre-processing is the preparation of raw sonar data for processing. It consists of smoothing of the navigation data and corrections for horizontal offsets of the towfish relative to the GPSantenna. The processing is the transformation of the raw data to usable images that will be radiometrically and geometrically correct representations of the seafloor. Geometric corrections consist of speed correction and slant-range-correction. Radiometric corrections include beam angle compensation, grazing angle compensation and filtering. The data is then ready for mosaicking, i.e. the creation of geo-referenced sonar images of the seafloor. The images are now ready for interpretation. Additionally, post-processing may be applied, which may constitute a definite plus for image visualisation. Typical post-processing procedures are the computation of image statistics, image histogram manipulations, and others. 9 Marines geophysikalisches Praktikum Literature Blondel, P. and Murton, B.J. (1997): Handbook of seafloor sonar imagery. - 314 p.; Chichester (Wiley). Davis, K.S., Slowey, N.C., Stender, I.H., Fiedler, H., Bryant, W.R. and Fechner, G. (1996): Acoustic backscatter and sediment textural properties of inner shelf sands, northeastern Gulf of Mexico. Geo-Marine Letters, 16 (3): 273-278; Berlin. Fish, J.P. and Carr, H.A. (1990): Sound underwater images. A guide to the generation and interpretation of side scan sonar data. - 188 p.; Orleans (Lower Cape Publishing). Flemming, B.W. (1976): Side-scan sonar: a practical guide. - International Hydrographic Review, 53 (1): 65-92; Monaco. Goff, J.A., Olson, H.C. and Duncan, C.S. (2000): Correlation of side-scan backscatter intensity with grain-size distribution of shelf sediments, New Jersey margin. - Geo-Marine Letters, 20 (1): 43-49; Berlin. Lurton, X. (2002): An introduction to underwater acoustics. Principles and applications. - 347 p.; London (Springer). Mazel, C. (1985): Side scan sonar record interpretation. - Salem (Klein Associates Inc.). 10
