Cell Transport Lab Series CP
advertisement
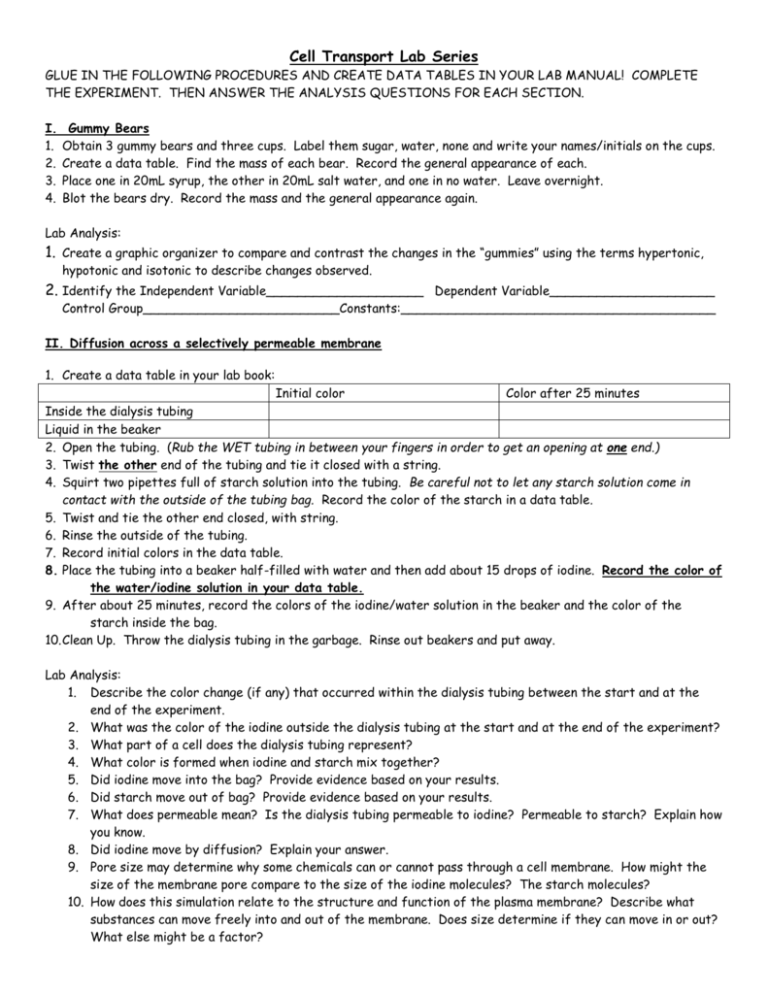
Cell Transport Lab Series GLUE IN THE FOLLOWING PROCEDURES AND CREATE DATA TABLES IN YOUR LAB MANUAL! COMPLETE THE EXPERIMENT. THEN ANSWER THE ANALYSIS QUESTIONS FOR EACH SECTION. I. 1. 2. 3. 4. Gummy Bears Obtain 3 gummy bears and three cups. Label them sugar, water, none and write your names/initials on the cups. Create a data table. Find the mass of each bear. Record the general appearance of each. Place one in 20mL syrup, the other in 20mL salt water, and one in no water. Leave overnight. Blot the bears dry. Record the mass and the general appearance again. Lab Analysis: 1. Create a graphic organizer to compare and contrast the changes in the “gummies” using the terms hypertonic, hypotonic and isotonic to describe changes observed. 2. Identify the Independent Variable____________________ Dependent Variable_____________________ Control Group_________________________Constants:________________________________________ II. Diffusion across a selectively permeable membrane 1. Create a data table in your lab book: Initial color Color after 25 minutes Inside the dialysis tubing Liquid in the beaker 2. Open the tubing. (Rub the WET tubing in between your fingers in order to get an opening at one end.) 3. Twist the other end of the tubing and tie it closed with a string. 4. Squirt two pipettes full of starch solution into the tubing. Be careful not to let any starch solution come in contact with the outside of the tubing bag. Record the color of the starch in a data table. 5. Twist and tie the other end closed, with string. 6. Rinse the outside of the tubing. 7. Record initial colors in the data table. 8. Place the tubing into a beaker half-filled with water and then add about 15 drops of iodine. Record the color of the water/iodine solution in your data table. 9. After about 25 minutes, record the colors of the iodine/water solution in the beaker and the color of the starch inside the bag. 10. Clean Up. Throw the dialysis tubing in the garbage. Rinse out beakers and put away. Lab Analysis: 1. Describe the color change (if any) that occurred within the dialysis tubing between the start and at the end of the experiment. 2. What was the color of the iodine outside the dialysis tubing at the start and at the end of the experiment? 3. What part of a cell does the dialysis tubing represent? 4. What color is formed when iodine and starch mix together? 5. Did iodine move into the bag? Provide evidence based on your results. 6. Did starch move out of bag? Provide evidence based on your results. 7. What does permeable mean? Is the dialysis tubing permeable to iodine? Permeable to starch? Explain how you know. 8. Did iodine move by diffusion? Explain your answer. 9. Pore size may determine why some chemicals can or cannot pass through a cell membrane. How might the size of the membrane pore compare to the size of the iodine molecules? The starch molecules? 10. How does this simulation relate to the structure and function of the plasma membrane? Describe what substances can move freely into and out of the membrane. Does size determine if they can move in or out? What else might be a factor? III. “Egg”-ceptional Investigation: Consider the following: The data collection will be over 2 days. You will use the same egg each day, measuring it after it is exposed to each variable. One egg in water will serve as the control for all experiments. Create a data table to record circumference of the egg, the mass of the egg, and the amount of liquid present.. Day One: Label a cup with your group’s names. Obtain one egg. CAREFULLY measure the circumference of the egg and record the mass of the egg. Place in 50 mL of Karo syrup and record this initial amount in your data table. Write a hypothesis about what will happen to the egg overnight. Day Two: Measure the circumference of and record the mass of your egg. Measure the amount of liquid present in the cup. Place the egg in 50mL of water. Write a hypothesis about what will happen to the egg overnight. 1. What are the Independent, Dependent and Control Group? Constants? 2. What quantitative/qualitative data will you measure? Safety: 1. Wash hands after handling eggs. 2. Eggs are very fragile – handle with care Conclusion: 1. Draw a picture depicting the events that took place during Day 1. 2. Draw a picture depicting the events that took place during Day 2. 3. Write a paragraph to explain what occurred during the lab. Be sure to include osmosis and a discussion of hypertonic and hypotonic environments and their relationship to the condition of the cell. IV. Observing Plasmolysis 1. Prepare a wet mount slide of an Elodea leaf. Do this by placing ONE leaf on a slide, cover with one drop of regular water, and place a cover slip on top. 2. Observe and sketch the leaf on 100x. Color your diagram. Write observations to describe the shape of the cells. Label the cell wall and chloroplasts. 3. Leave your slide IN PLACE on the microscope and add a drop of salt water solution to the edge of the cover slip. 4. Immediately observe and sketch the cells. Color your diagram. Write observations to describe the changes that occurred in the cells. Label the cell membrane (if you can see it), the cell wall, and chloroplasts. 5. Repeat steps 4 and 5 using freshwater AGAIN instead of salt water. 6. Clean up. Lab Analysis: 1. Go back and label your diagrams: 2. Using the diagrams you produced during the lab, describe the location of the chloroplasts in relation to the cell wall in regular water and then again in salt water. 3. Using the written observations from your data table, describe the changes that take place within the cell as salt water is placed on it. 4. What is the definition of plasmolysis? Is this what happened to the cell observed in this lab? Explain. 5. Did salt move into the cell through the cell membrane? Why or why not? 6. Write a paragraph to explain what occurred during the lab. Be sure to include osmosis and a discussion of hypertonic and hypotonic environments and their relationship to the condition of the cell observed.
