D-3 CREATION OF A TYPOLOGY OF WELLS IN AN OIL FIELD
advertisement
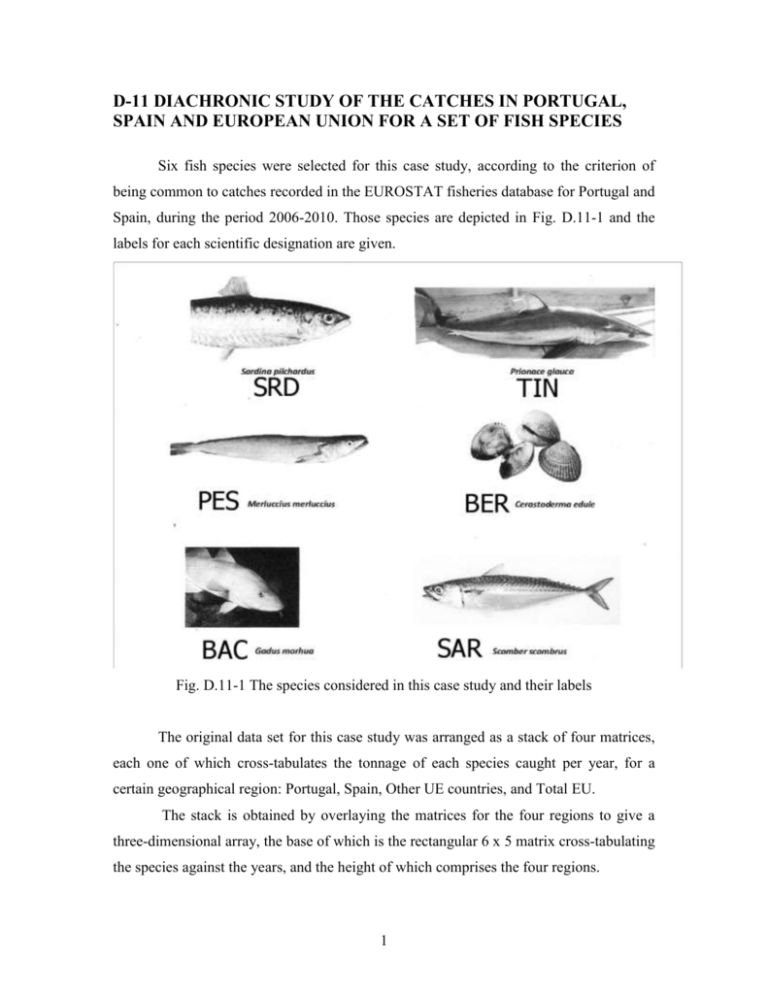
D-11 DIACHRONIC STUDY OF THE CATCHES IN PORTUGAL, SPAIN AND EUROPEAN UNION FOR A SET OF FISH SPECIES Six fish species were selected for this case study, according to the criterion of being common to catches recorded in the EUROSTAT fisheries database for Portugal and Spain, during the period 2006-2010. Those species are depicted in Fig. D.11-1 and the labels for each scientific designation are given. Fig. D.11-1 The species considered in this case study and their labels The original data set for this case study was arranged as a stack of four matrices, each one of which cross-tabulates the tonnage of each species caught per year, for a certain geographical region: Portugal, Spain, Other UE countries, and Total EU. The stack is obtained by overlaying the matrices for the four regions to give a three-dimensional array, the base of which is the rectangular 6 x 5 matrix cross-tabulating the species against the years, and the height of which comprises the four regions. 1 To prepare the data for input to CA requires the stack to be put in the form of concatenated contingency tables1. Two arrangements were used, each giving a different data model, as shown in Fig. D.11.2 by the paths (1) and (2). Fig. D-11.2 – Data models obtained for 2 arrangements of the initial data set . 1 It is worth noting that all above defined matrices can be considered as two-way contingency tables, since the tonnage is proportional to the absolute frequency of individuals. 2 Two trials were conducted to compare Portugal with Spain using data model (1); the first takes the Portugal block as active and the Spain block as supplementary, and the second takes the Spain block as active and the Portugal block as supplementary. The first trial did not yield interpretable results because, as shown in Fig. D-11.3, there is no ordered sequence of years. However, an interpretable plot is obtained when the Spain block is active and the Portugal block is supplementary, as shown in Fig. D-11.4, in which there is an ordered sequence of years along axis 1. Fig. D-11.3 Projections of the years onto the principal plane (Portugal as active) Fig. D-11.4 Projections of the years onto the principal plane (Spain as active) 3 Now, for interpreting the association of species caugh by Spain and Portugal along the period of 2006-2010, the graph shown in Fig. D.11.5 was constructed (the species’ labels are assigned to each country by using the code p and e preceeding the general labels given in Fig. D-11.1). Fig. D-11.5 Projections of the species onto the principal plane (Spain as active) The the following conclusions can be drawn from Figs. D.11.4 and D-11.5: 1. For Spain, the following species (sorted according to the sequence of the years) are connected to axis 1, which is the time direction: SRD → TIN → BAC 2. For Spain, the following species are connected to axis 2, which opposes 2006 to 2007: PES, associated with 2006, and SAR, associated with 2007 (eBER does .not meet the absolute contribution threshold for axis 1 or 2, and hence it was not plotted in Fig. D-11.5, because it cannot be interpreted in the principal plane). 3. For Portugal, the following especies are considered significant in terms of their relative contributions: for axis 1, SRD, BAC, SAR, PES (all connected with the left side of the axis, and consequently, with 2006 and 2007); for axis 2, BER is associated with 2006 because it projects onto the positive semi-axis, and SAR is assiciated with 2007 because it ptojects onto the negative semi-axis. pTIN is not 4 significantly connected either to axis 1 or axis 2, and, thereby, it was not plotted in Fig. D-11.5). 4. Comparing the species caught by Portugal and Spain along axis 1, there is a positive correlation for SRD (sardines) and a negative correlation for BAC (cod)2, meaning that the area in which sardines are caught is common to both countries, whereas cod is caught in different areas. From axis 2, for the year 2006, BER (clams) caught by Portugal is associated with PES (hake) caught by Spain. To explore the structure of Portuguese and Spanish catches in the context of the EU, we now use the EU block as active and project the remaining blocks as suplementary (including, for the sake of completeness, the other EU countries). The CA principal plane for the sequence of years is given in Fig. D-11.6, where axis 1 is again interpreted as the time direction and axis 2 opposes 2006 to 2007. Note the rough similarity between Figs. D-11.4 and D-11.6, which demonstrates the dominant position of Spain with respect to the EU. Fig. D-11.6 Projections of the years onto the principal plane (EU as active) 2 In fact, SRD projects onto the left side of axis 1, for both Portugal and Spain, whereas BAC projects 5 In Fig. D-11.7 it is shown the projections of species onto the principal plane provided by CA when the block EU is taken as active and the remaining as supplementary. The letter u preceding a label denotes EU and the letter o preceding a label denotes Other EU. Fig. D-11.7 Projections of the species and years onto the principal plane (EU as active) For EU, with the species projected as active individuals, the interpretation of the axes leads to the following conclusions: Axis 1 opposes BER+SRD (which projects onto the negative semi-axis), to TIN (which projects onto the positive semi-axis); axis 2 opposes PES+BAC (which projects onto the positive semi-axis), to SAR, which projects onto the negative semi-axis. \ Hence, the principal plane may be interpreted in terms of the EU active block by stating that BER+SRD are associate with 2006+2007+2008, whereas TIN is associated with more recent years 2009 and 2010. On the other hand, the species PES and BAC are associated with 2006, and SAR is associated with 2007. Having interpreted the active variables and individuals, we now select the supplementary projected species that are significant, in terms of relative contributions of axes 1 and 2 to their projections onto the principal plane created by the EU block (Fig. D11.8). 6 Fig. D-11.8 Projections of the species for Portugal Spain and Other onto the principal plane (EU as active) On the left side of axis 1 the following species caught by each country are retained as significant: BER (for Other EU), and SRD (for Portugal and Spain). On the right side of axis 1, the following species caught by each country are retained as significant: TIN (for Portugal), SAR and PES (for Other EU), BER, BAC and TIN (for Spain). On the upper part of axis 2, the following species caught by each country are retained as significant: BER, for Portugal and PES, for Spain; on the lower part of axis 2, only TIN is significant for Other EU. Within the total EU context, the correlation of SRD for Portugal and Spain is maintained for 2006/2007/2008, as is the association of BER caught by Portugal with PES caught by Spain for the year 2006. … In what concerns the application of CA to the data model (2) of Fig. D-11.2, two trials were also conducted: the first with the Spain block as active (and the Portugal block as supplementary); the second with the EU block as active, and all regions projected as supplementary blocks. For the active matrices, the results are the same as interpreted in Fig. D-11.4 and D-11.5 for Spain, and D-11.6 and D-11.7, for the EU, because the matrices are the same for both cases. 7 New results emerge referring to the sequence of years for Portugal with respect to Spain (as shown in Fig. D-11.9), and for the sequence of years for all the regions with respect to EU, as shown in Fig. D-11.10 (the species maintain their positions they have in Fig. D.11.5 and D.11.7). We now assign labels comprising a region code, PT (Portugal), ES (Spain), Ot (Other EU) and EU, followed by a two-digit year identifier. Fig. D-11.9 – Supplementary projection of Portugal onto the axes provided by Spain as active The interpretation of Fig. D-11.9 is clear: all years referring to Portugal project onto the negative semi-axes 1 and 2, being therefore associated, for Spain, with the year 2006 (connected with SRD through Axis 1) and 2007 (connected with SAR through Axis 2). Regarding Fig. D.11.10, the significant relative contributions of Axis 1 to all modalities of the years for Portugal allow connecting such modalities to early years, referring to EU. On the other hand, Spain is connected with all the EU sequence of years, being Other countries associated with more recent years, in respect to EU. This analysis means that Portugal opposes to Other countries (the former relating to early years and the latter to more recent years). In what Spain in concerned, it follows the general sequence of EU years. 8 Fig. D-11.10 – Supplementary projection of Portugal, Spain, and Other countries onto the axes provided by EU as active In summary, for species, the patterns of sardine catches for Spain and Portugal are similar, whereas the clam catch for Portugal is similar to the hake catch for Spain. For the time sequence, Spain and the EU have similar patterns of catches whereas Portugal, even though exhibiting no pattern of catches, may be (weakly) associated with EU and Spain for 2007 and with Other EU countries for 2009-2010. SOURCE: Project for the course Natural Resources Management and Planning (2011-2012) 9
