BIOSTAT516 Statistical Methods in Genetic Epidemiology
advertisement
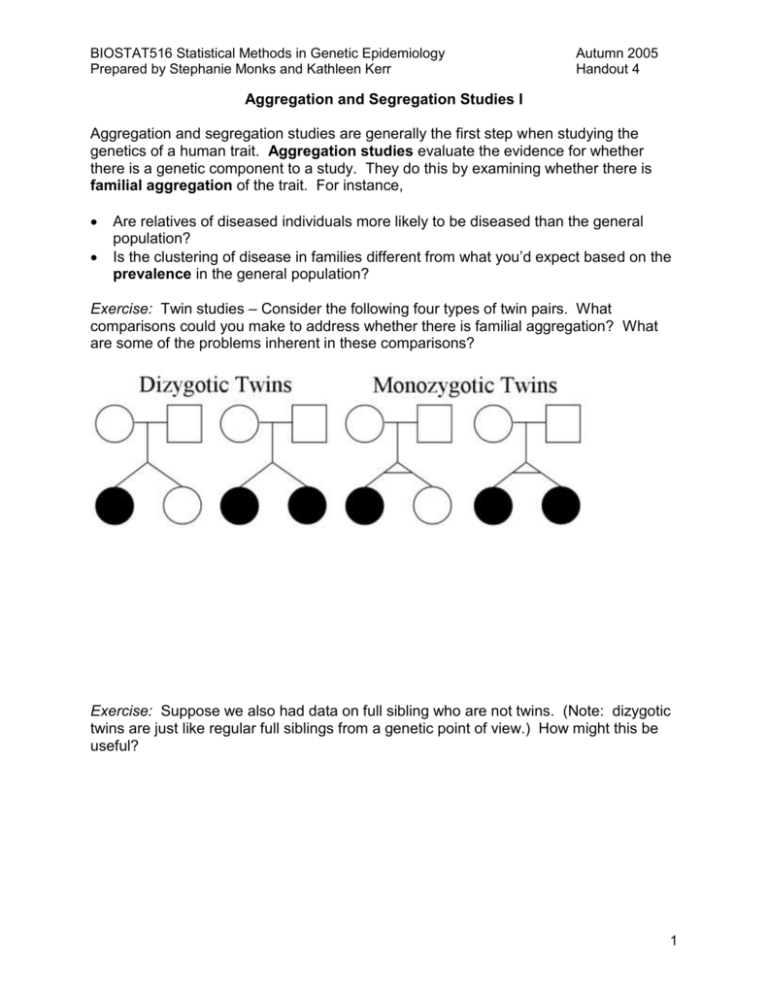
BIOSTAT516 Statistical Methods in Genetic Epidemiology Prepared by Stephanie Monks and Kathleen Kerr Autumn 2005 Handout 4 Aggregation and Segregation Studies I Aggregation and segregation studies are generally the first step when studying the genetics of a human trait. Aggregation studies evaluate the evidence for whether there is a genetic component to a study. They do this by examining whether there is familial aggregation of the trait. For instance, Are relatives of diseased individuals more likely to be diseased than the general population? Is the clustering of disease in families different from what you’d expect based on the prevalence in the general population? Exercise: Twin studies – Consider the following four types of twin pairs. What comparisons could you make to address whether there is familial aggregation? What are some of the problems inherent in these comparisons? Exercise: Suppose we also had data on full sibling who are not twins. (Note: dizygotic twins are just like regular full siblings from a genetic point of view.) How might this be useful? 1 BIOSTAT516 Statistical Methods in Genetic Epidemiology Prepared by Stephanie Monks and Kathleen Kerr Autumn 2005 Handout 4 Example: Alzheimer’s Disease1 - Studies based on twins have found differences in concordance rates between monozygotic and dizygotic twins. In particular, 80% of monozygotic twin pairs were concordant whereas only 35% of dizygotic twins were concordant. In a separate study, first-degree relatives of individuals (parents, offspring, siblings) with Alzheimer’s disease were studied. First degree relatives of patients had a 3.5 fold increase in risk for developing Alzheimer’s disease as compared to the general population. This was age-dependent with the risk decreasing with ageof-onset. Segregation analysis moves beyond aggregation of disease and seeks to more precisely identify the factors responsible for familial aggregation. For instance, Is the aggregation due to environmental, cultural or genetic factors? What proportion of the trait is due to genetic factors? What mode of inheritance best represents the genetic factors? Does there appear to be genetic heterogeneity? Definitions Mode of inheritance – “The manner in which a particular genetic trait or disorder is passed from one generation to the next. Autosomal dominant, autosomal recessive, Xlinked dominant, X-linked recessive, multifactorial, and mitochondrial inheritance are examples.”2 Genetic heterogeneity – “The presence of apparently similar characters for which the genetic evidence indicates that different genes or different genetic mechanisms are involved in different pedigrees. In clinical settings genetic heterogeneity refers to the presence of a variety of genetic defects (that) cause the same disease, often due to mutations at different loci on the same gene, a finding common to many human diseases including alzheimer's disease, cystic fibrosis, lipoprotein lipase and polycystic kidney disease.”3 Pedigree – “A diagram of the genetic relationships and medical history of a family using standardized symbols and terminology.”2 Founder – Individuals in a pedigree whose parents are not part of the pedigree. 1 Bishop T, Sham P (2000) Analysis of multifactorial disease. Academic Press, San Diego. Genetic Home Reference Glossary, http://ghr.nlm.nih.gov/ghr/glossary 3 Medical Dictionary Search Engine, http://www.books.md/ 2 2 BIOSTAT516 Statistical Methods in Genetic Epidemiology Prepared by Stephanie Monks and Kathleen Kerr Autumn 2005 Handout 4 Mode of Inheritance Inheritance of a trait can be broken into two classes. A simple Mendelian trait can be modeled precisely using Mendel’s laws. Generally, these traits are close to completely penetrant and are a function of a small number of factors. Complex traits are everything else: traits with all other modes of inheritance and generally involving more than a single genetic factor, reduced penetrance, and variation due to environmental factors. On top of all that, there might be interactions between genetic and environmental factors. Many statistical methods in genetic epidemiology explicitly model the inheritance for a trait. A model seeks to mathematically explain the inheritance of a trait. Based on some assumptions, the model defines the relationship between the train and genetic and/or environmental factors. What are an advantage and a disadvantage of using an explicit model? One distinguishing feature among methods is whether they explicitly model the mode of inheritance. For methods that explicitly model the mode of inheritance, it is clearly important to understand the underlying model. However, the performance of all methods depends on the true underlying mode of inheritance. Therefore, even for methods that do not explicitly model the mode of inheritance, It is important to have a good understanding of how factors can come together to affect a trait. This will allow for a better understanding of how all methods perform. 3 BIOSTAT516 Statistical Methods in Genetic Epidemiology Prepared by Stephanie Monks and Kathleen Kerr Autumn 2005 Handout 4 Exercise: Characterize the pattern of inheritance one would expect to see in a pedigree for autosomal dominant and recessive genes. Do the same for x-linked inheritance. Assume full penetrance. Dominant autosomal Recessive autosomal Dominant X-linked Recessive X-linked 4 BIOSTAT516 Statistical Methods in Genetic Epidemiology Prepared by Stephanie Monks and Kathleen Kerr Autumn 2005 Handout 4 Models of genetic inheritance What are the basic parts to a model of genetic inheritance? Population parameters e.g. allele/genotype frequencies Transmission parameters e.g. P(A transmitted to offspring | AB parent), recombination fraction Penetrance parameters o For a dichotomous trait, a penetrance parameter is defined for each genotype as the P(trait | genotype). Exercise: Complete the table below for a discrete and completely penetrant disease mutation for dominant and recessive modes of inheritance. Mode of Inheritance Dominant Recessive P(disease | DD) P(disease | DN) P(disease | NN) o For a quantitative trait, Y, the penetrance function describes the distribution of the trait conditional on an individual’s genotype, P(Y | genotype). A quantitative trait controlled by a dominant gene: A quantitative trait controlled by a recessive gene: A quantitative trait controlled by an additive gene: 5 BIOSTAT516 Statistical Methods in Genetic Epidemiology Prepared by Stephanie Monks and Kathleen Kerr Autumn 2005 Handout 4 Exercise: Consider a mutation with dominant mode of inheritance with allele frequency Pr(D)=p. The goal is to write down the probability that the sibling of a diseased child will be diseased. In other words, find the following: P(sibling AND individual are diseased) P(sibling has disease | diseased individual) P(diseased individual) To figure this out, you need to go through a number of steps using different properties of probabilities: 1. To calculate the denominator, we must figure out the probability of a diseased individual. Note that Pr(disease ) Pr(genotyp e)Pr(disea se | genotype) ge notypes 2. What types of matings could produce a diseased child and how frequent is each mating in the population? There will be 5 mating types. 3. For each mating type, what is the probability of producing a pair of diseased children? Note that given the parental mating type, transmissions to offspring are independent. 4. Based on the answers to parts 2 and 3, we can calculation the numerator. We often will need to work with the following equality: Pr(event ) Pr(mating type)Pr(e vent | mating type) mating types 2. Mating Type 2. P(Mating Type) 3. P(affected sib pair|Mating Type) 6 BIOSTAT516 Statistical Methods in Genetic Epidemiology Prepared by Stephanie Monks and Kathleen Kerr Autumn 2005 Handout 4 Why does it make sense that the probability is near ½ when the allele frequency is almost 0? 7 BIOSTAT516 Statistical Methods in Genetic Epidemiology Prepared by Stephanie Monks and Kathleen Kerr Autumn 2005 Handout 4 50 40 30 20 10 0 S ib lin g R isk o f D ise a se G ive n D ise a se d In d ivid u a l We can also calculate what is referred to as the sibling risk ratio based on a completely penetrant dominant mutation. The sibling risk ratio is P(disease | sibling has disease) . In general, the risk ratio is a function of both the P(disease) disease penetrances and the allele frequency of the disease locus. However, since we assumed a completely dominant mutation (penetrance=1 in the presence of the disease allele), we end up with a function of just p: 0.0 0.2 0.4 0.6 0.8 1.0 Pr(D) We will go into detail about such “relative risk ratios” in another handout. 8
