1 SUPPLEMENTAL MATERIAL Supplemental Table 1. The
advertisement
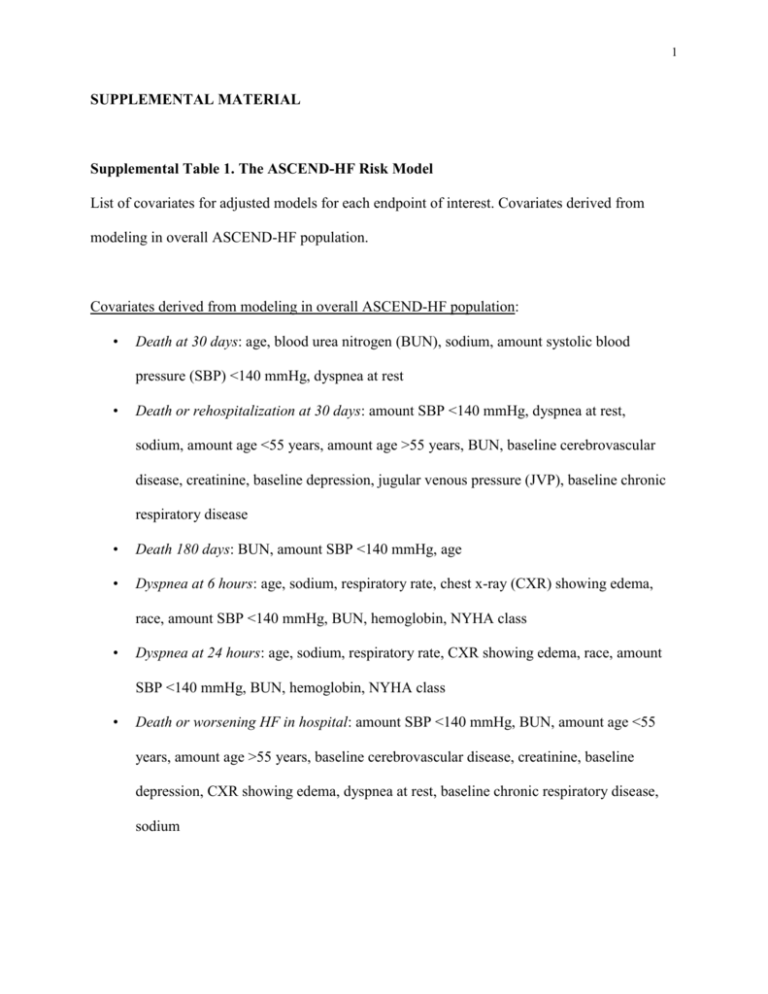
1 SUPPLEMENTAL MATERIAL Supplemental Table 1. The ASCEND-HF Risk Model List of covariates for adjusted models for each endpoint of interest. Covariates derived from modeling in overall ASCEND-HF population. Covariates derived from modeling in overall ASCEND-HF population: • Death at 30 days: age, blood urea nitrogen (BUN), sodium, amount systolic blood pressure (SBP) <140 mmHg, dyspnea at rest • Death or rehospitalization at 30 days: amount SBP <140 mmHg, dyspnea at rest, sodium, amount age <55 years, amount age >55 years, BUN, baseline cerebrovascular disease, creatinine, baseline depression, jugular venous pressure (JVP), baseline chronic respiratory disease • Death 180 days: BUN, amount SBP <140 mmHg, age • Dyspnea at 6 hours: age, sodium, respiratory rate, chest x-ray (CXR) showing edema, race, amount SBP <140 mmHg, BUN, hemoglobin, NYHA class • Dyspnea at 24 hours: age, sodium, respiratory rate, CXR showing edema, race, amount SBP <140 mmHg, BUN, hemoglobin, NYHA class • Death or worsening HF in hospital: amount SBP <140 mmHg, BUN, amount age <55 years, amount age >55 years, baseline cerebrovascular disease, creatinine, baseline depression, CXR showing edema, dyspnea at rest, baseline chronic respiratory disease, sodium 2 Supplemental Table 2. Comparison of Prognostic Value of Baseline sST2 vs. NT-proBNP as Dichotomous Variables 30-day Death/ HF 180-day Death Hospitalization OR p-value HR p-value Baseline sST2 vs. baseline NT-proBNP Model 1 sST2 ≥71.2 ng/mL 1.81 (1.17-2.78) 0.0073 2.22 (1.45-3.4) 0.0002 Model 2 (unadjusted) sST2 ≥71.2 ng/mL 1.41 (0.88-2.24) 0.1516 1.46 (0.93-2.3) 0.1036 NT-proBNP ≥5,000 pg/mL 1.79 (1.11-2.88) 0.0174 2.63 (1.59-4.35) 0.0002 Model 3* (adjusted) sST2 ≥71.2 ng/mL 1.27 (0.79-2.02) 0.3252 1.21 (0.77-1.9) 0.4011 NT-proBNP ≥5,000 pg/mL 1.91 (1.19-3.07) 0.0072 1.79 (1.07-3.02) 0.0277 48–72 hr sST2 vs. 48–72 hr NT-proBNP Model 1 sST2 ≥71.2 ng/mL 2.09 (1.28-3.41) 0.0032 2.90 (1.81-4.63) <0.0001 Model 2 (unadjusted) sST2 ≥71.2 ng/mL 1.76 (1.06-2.93) 0.0302 2.11 (1.29-3.43) 0.0027 NT-proBNP ≥5,000 pg/mL 1.71 (1.05-2.8) 0.032 2.76 (1.68-4.53) 0.0001 sST2 ≥71.2 ng/mL 1.26 (0.73-2.2) 0.4047 1.77 (1.09-2.87) 0.0214 NT-proBNP ≥5,000 pg/mL 1.58 (0.94-2.65) 0.0832 1.86 (1.08-3.21) 0.0256 Model 3* (adjusted) 30-day sST2 vs. 30-day NT-proBNP Model 1 -- -- sST2 ≥71.2 ng/mL Model 2 (unadjusted) 2.23 (1.17-4.25) 0.0145 -- -- sST2 ≥71.2 ng/mL 1.26 (0.61-2.61) 0.539 NT-proBNP ≥5,000 pg/mL 5.82 (2.64-12.8) <0.0001 Model 3* (adjusted) -- -- 1.13 (0.54-2.37) 0.7515 3 sST2 ≥71.2 ng/mL NT-proBNP ≥5,000 pg/mL * 3.59 (1.50-8.59) 0.0041 Model 3 also adjusted with blood urea nitrogen, age, and systolic blood pressure as covariate adjustments. HF = heart failure; HR = heart rate; NT-proBNP = aminoterminal pro-B-type natriuretic peptide; OR = odds ratio; sST2 = soluble growth stimulation expressed gene 2 4 Supplemental Table 3. Net Reclassification for Baseline and 48–72 Hour Follow-Up sST2 Levels Category-free net reclassification improvement and integrated discrimination improvement to quantify improvement in model performance. The risk of death at 180 days was estimated using the Cox model; p-values compare models with/without sST2. All models were adjusted for age, blood urea nitrogen, systolic blood pressure, and NT-proBNP (at corresponding timepoints). A. Baseline sST2 Without vs. With Baseline sST2 AUC Value (%) p-value 78.33 vs 78.5 0.911 23 <0.001 10.76 0.001 Integrated discrimination improvement Net reclassification improvement Events correctly reclassified (%) 8.64 Non-events correctly reclassified (%) 2.12 AUC = area under the curve; NT-proBNP = aminoterminal pro-B-type natriuretic peptide; sST2 = soluble growth stimulation expressed gene 2 B. 48-72 hour Follow-up sST2 Without vs. With 48–72 Hour Follow-up sST2 AUC Value (%) p-value 73.94 vs. 76.08 0.227 18 <0.001 15.6 0.027 Integrated discrimination improvement Net reclassification improvement Events correctly reclassified (%) 13.85 Non-events correctly reclassified (%) 1.75 All abbreviations can be found in Supplemental Table 3A. 5 C. 30-day Follow-up sST2 Without vs. With 30-day Follow-up sST2 AUC Value (%) p-value 80.03 vs 82.02 0.38 30 <0.001 15.2 0.035 Integrated discrimination improvement Net reclassification improvement Events correctly reclassified (%) 13.89 Non-events correctly reclassified (%) 1.31 All abbreviations can be found in Supplemental Table 3A. 6 Supplemental Table 4. Checking Independency Between Baseline sST2 and NT-proBNP as Continuous Variables 30-Day Death p-value 30-Day Death/HF p-value 180-Day Death OR (95% CI) Rehospitalization HR (95% CI) p-value OR (95% CI) Unadjusted Model Baseline sST2 1.75 (0.79, 3.89) 0.168 1.32 (0.87, 2.01) 0.196 1.40 (0.92, 2.13) 0.11 Baseline NT-proBNP 1.57 (0.99, 2.49) 0.054 1.23 (0.97, 1.55) 0.084 1.87 (1.51, 2.32) <0.0001 Baseline sST2 0.63 (0.001, 496.8) 0.890 0.07 (0.006, 1.11) 0.059 0.82 (0.03, 25.83) 0.908 Baseline NT-proBNP 0.94 (0.04, 23.48) 0.971 0.29 (0.07, 1.12) 0.072 1.44 (0.25, 8.43) 0.686 Interaction: sST2/NT-proBNP 1.12 (0.54, 2.35) 0.761 1.41 (1.02, 1.94) 0.036 1.06 (0.72, 1.56) 0.766 Baseline sST2 0.19 (0.001,114.2) 0.608 0.05 (0.001, 0.810) 0.035 0.37 (0.01, 11.94) 0.576 Baseline NT-proBNP 0.45 (0.02-11.53) 0.631 0.26 (0.07, 0.99) 0.049 0.84 (0.14-5.03) 0.848 Interaction: sST2/NT-proBNP 1.26 (0.62-2.57) 0.527 1.39 (1.04, 1.95) 0.028 1.15 (0.78-1.69) 0.492 Interaction Model Adjusted Interaction Model CI = confidence interval; NT-proBNP = aminoterminal pro-B-type natriuretic peptide; OR = odds ratio; sST2 = soluble growth stimulation expressed gene 2 7 Supplemental Table 5. Baseline Characteristics Across Changes of sST2 Levels From Baseline to 48–72 Hour sST2 Levels (at 71.2 ng/mL cut-off, n=680 With Both Baseline and 48–72 Hour Samples) sST2 Levels Low-Low High-Low Low-High High-High (n=318) (n=199) (n=15) (n=148) Age (years) 62.8±14.8 67.9±14.6 70.8±12.5 67.3±15.6 <0.001 Female (%) 34.3 29.6 13.3 37.0 0.168 Race (%) 63.5 69.3 66.7 72.3 0.249 Systolic BP (mmHg) 129.0±21.1 128.0±17.4 133.1±23.7 121.9±18.5 0.002 Heart rate (bpm) 79.8±15.2 81.5±17.4 76.6±15.5 78.4±16.3 0.265 Atrial fibrillation (%) 32.7 45.2 53.3 51.4 <0.001 Hypertension (%) 82.1 76.9 66.7 73.0 0.088 25.0±14.2 27.3±13.8 28.3±13.9 34.6±17.8 <0.001 Creatinine (mg/dL) 1.4±0.5 1.4±0.6 1.5±0.5 1.6±0.6 <0.001 Sodium (mmol/L) 139.2±3.2 138.3±4.1 139.4±5.2 138.2±4.5 0.038 3,878 6,999 8,512 8,464 <0.001 BUN (mg/dL) NT-proBNP (pg/mL) p-value (2,193-7,865) (3,625-13,033) (3,178-11,207) (4,612-15,058) LVEF (%) 27 (20-40) 25 (20-40) 35 (25-45) 25 (15-35) 0.041 Time from presentation 17.2±10.2 14.6±8.3 16.9±7.9 17.1±9.8 0.023 Beta-blockers (%) 76.1 75.4 80.0 79.7 0.774 ACEi or ARB (%) 65.4 63.8 76.7 62.8 0.317 MRA (%) 23.9 19.6 26.7 32.4 0.052 to randomization (hr) Values in mean ± standard deviation or median (interquartile range) ACEi = angiotensin-converting enzyme inhibitor; ARB = angiotensin receptor blocker; BP = blood pressure; bpm = beats per minute; BUN = blood urea nitrogen; LVEF = left ventricular ejection fraction; MRA = mineralocorticoid receptor antagonist; NT-proBNP = aminoterminal pro-B-type natriuretic peptide; sST2 = soluble growth stimulation expressed gene 2 8 Supplemental Figure 1. Interaction Plot Between Baseline sST2 and NT-proBNP Interaction plot between baseline sST2 and NT-proBNP using restricted cubic splines, stratified by median baseline NT-proBNP levels. HF = heart failure; NT-proBNP = aminoterminal pro-B-type natriuretic peptide; sST2 = soluble growth stimulation expressed gene 2 9 Supplemental Figure 2. Kaplan-Meier Analysis for 180-Day Survival Kaplan-Meier analysis for 180-day survival stratified by median baseline sST2 and NT-proBNP levels. Median levels for sST2 = 71.2 ng/mL; median levels of NT-proBNP = 5,756 pg/mL (median from whole cohort and not analytical set). HF = heart failure; NT-proBNP = aminoterminal pro-B-type natriuretic peptide; sST2 = soluble growth stimulation expressed gene 2 10 Supplemental Figure 3. Kaplan-Meier Curves of 180-Day Death Kaplan-Meier curves of 180-day death stratified by tertiles of ST2 levels at 30 days. 30-day sST2 quartile (Q) ranges: Quartile 1 = <28.0 ng/mL; Quartile 2 = 28.0–39.47 ng/mL; Tertile 3 = 39.474–63.9 ng/mL; Quartile 4 >63.9 ng/mL. sST2 = soluble growth stimulation expressed gene 2 11 Supplemental Figure 4. Comparison of Adverse Clinical Outcomes Comparison of adverse clinical outcomes in patients with a >30% (n=377) versus ≤30% (n=303) reduction in sST2 levels from baseline to 48–72 hours. HF = heart failure; sST2 = soluble growth stimulation expressed gene 2 12 Supplemental Figure 5. CONSORT Diagram of Subgroup Distribution CONSORT diagram of subgroup distribution according to baseline and follow-up sST2 levels. sST2 = soluble growth stimulation expressed gene 2 13 Supplemental Figure 6. Kaplan-Meier Curves of 180-Day Death Kaplan-Meier survival analysis stratified by high versus low baseline and follow-up (48–72 hour) sST2 levels (cut-off at 71.2 ng/mL) with all subgroups included.
