Model of surface region, for construction of concentration depth profile
advertisement
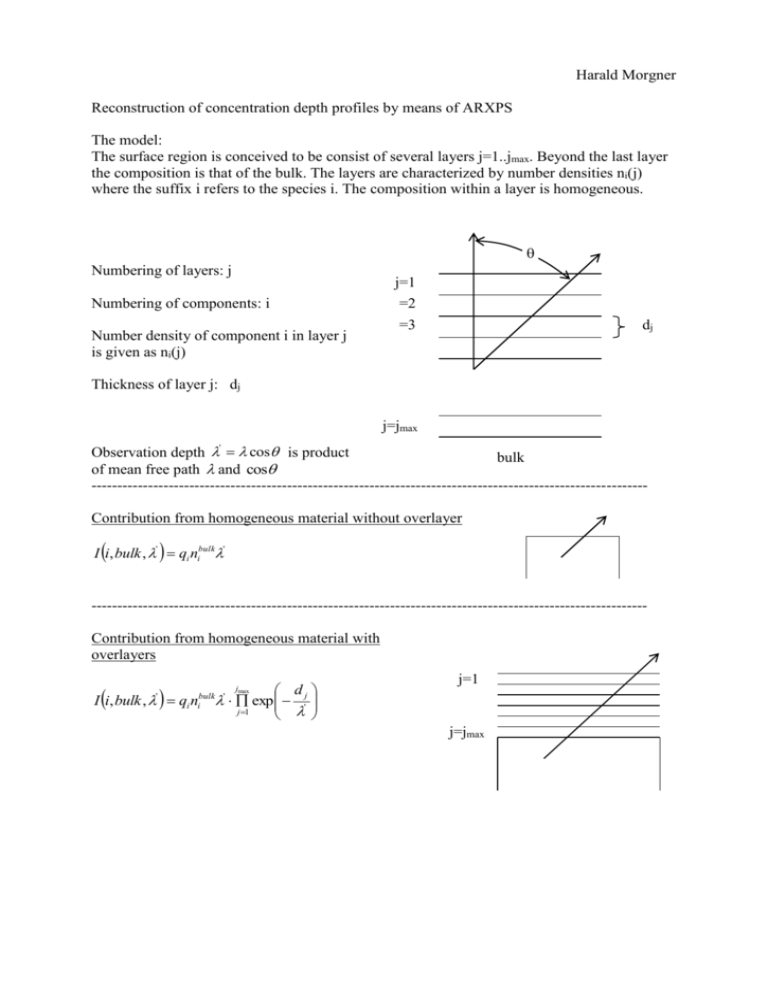
Harald Morgner Reconstruction of concentration depth profiles by means of ARXPS The model: The surface region is conceived to be consist of several layers j=1..jmax. Beyond the last layer the composition is that of the bulk. The layers are characterized by number densities ni(j) where the suffix i refers to the species i. The composition within a layer is homogeneous. Numbering of layers: j Numbering of components: i Number density of component i in layer j is given as ni(j) j=1 =2 =3 dj Thickness of layer j: dj j=jmax Observation depth ' cos is product bulk of mean free path and cos -----------------------------------------------------------------------------------------------------------Contribution from homogeneous material without overlayer I i, bulk , ' qi nibulk' -----------------------------------------------------------------------------------------------------------Contribution from homogeneous material with overlayers I i, bulk , q n ' d exp 'j j 1 bulk ' i i jmax j=1 j=jmax --------------------------------------------------------------------------------------------------------------Contribution from species i in layer j d j 1 d I i, j, qi ni j ' 1 exp 'j exp ' j j 1 j' Photoionization cross section for wobei species i die observation depth number density of species i in layer j Variation of the number densities ni(j) until the calculated intensities agree with the experimental intensities within the experimental errors. i I exp i, ' I calc i, ' I exp i, ' 2 deviation Standard-method for this fitting process is Marquardt-fit Disadvantage: may end in a local minimum Genetic Algorithm is very robust and yields estimate of accuracy Recommended reference: Eschen et al, J. Phys. Condens. Matter 7 (1995) 1961-78 ----------------------------------------------------------------------------------------------------------------Remark: The direct determination of the concentration depth profiles via Inverse Laplace Transformation is only a theoretical possibility The Laplace Transformed F s of the function f t is given by the expression L f t F s exp st f t dt 0 In principal the inversion can be carried out, i.e. f t can be reconstructed from F s The task to be carried out for constructing the concentration depth profiles has the same mathematical structure as constructing the inverse Laplace transformed. The expression I i ' ni z e z 1 ' dz 0 can be conceived as Laplace Transformed of ni z . Thus, the construction of ni z from I render the result for n z unreliable. I i ' could be done. In practice, this attempt fails because already small uncertainties in ' i i


