Torry Pines to Fletcher Cove
advertisement
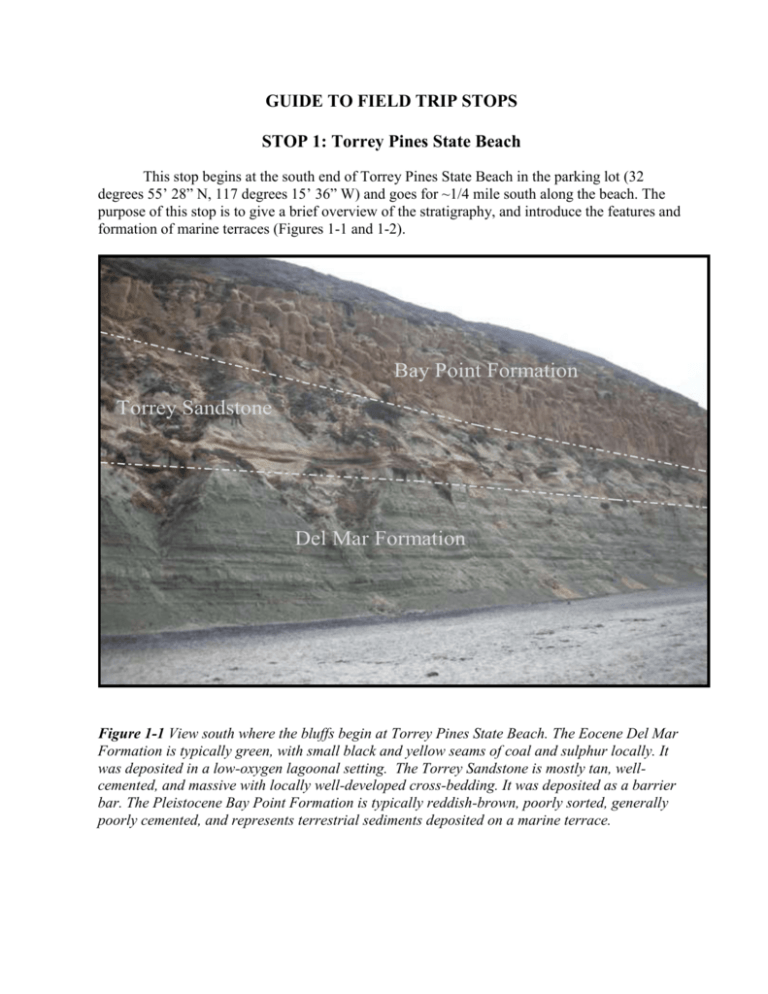
GUIDE TO FIELD TRIP STOPS STOP 1: Torrey Pines State Beach This stop begins at the south end of Torrey Pines State Beach in the parking lot (32 degrees 55’ 28” N, 117 degrees 15’ 36” W) and goes for ~1/4 mile south along the beach. The purpose of this stop is to give a brief overview of the stratigraphy, and introduce the features and formation of marine terraces (Figures 1-1 and 1-2). Bay Point Formation Torrey Sandstone Del Mar Formation Figure 1-1 View south where the bluffs begin at Torrey Pines State Beach. The Eocene Del Mar Formation is typically green, with small black and yellow seams of coal and sulphur locally. It was deposited in a low-oxygen lagoonal setting. The Torrey Sandstone is mostly tan, wellcemented, and massive with locally well-developed cross-bedding. It was deposited as a barrier bar. The Pleistocene Bay Point Formation is typically reddish-brown, poorly sorted, generally poorly cemented, and represents terrestrial sediments deposited on a marine terrace. paleo-valley wall marine terrace deposits Torrey Sandstone Figure 1-2 This site is in the south parking lot at Torrey Pines State Beach. Here we see an unconformable contact between the Torrey Sandstone and a much younger marine terrace deposit. This contact represents the edge of the valley when the marine terrace was formed. STOP 2: Del Mar to Fletcher Cove The walk begins at the bluffs north of the tidal channel at Del Mar “Dog Beach” (GPS N32.976260° W117.270660°) and goes for ~1.1 mile north along the beach to Fletcher Cove. Site 2-1: View from the bluff top at dog beach. From the beach, take the trail up to the bluff top. The prominent headland on the horizon to the south is La Jolla. Notice the headland’s “staircase” profile. The “steps” are marine terraces elevated as the land rose due to compression along the Rose Canyon Fault. Your view east looks up the valley and lagoon of the San Dieguito River. Most coastal lagoons in San Diego County were originally river canyons cut during Pleistocene sea level low stands. As the sea rose, the valleys filled up with lagoon and river deposits. Visualize the sea continuing to rise so that the beach shifts eastward into the lagoon. That is a reasonable analog for the stratigraphic transition between the Del Mar Formation (lagoon) and Torrey Sandstone (beach) that we saw at STOP 1 and will see again in the bluffs below. Site 2-2: Bluffs at the north end of dog beach. Descend to the beach where the bluffs begin at the beach. Notice the contact that represents a paleo-valley wall (Fig. 2-1). The valley formed when the San Dieguito River lagoon was cut during low sea level and subsequently filled in. Looking north, notice that the bluffs comprise a lower cliff-forming portion and an upper slope-forming portion. The lower cliff portion is made of relatively resistant Eocene rock formations (see below). The upper slope portion is made of poorly consolidated sands of the Pleistocene Bay Point Formation. The lower bluff exposes the Eocene Del Mar Formation and overlying Torrey Sandstone. The transition between the two formations represents a marine transgression (beach over coastal lagoon). The contact corresponds to the color change from the greenish muddy sandstones of the Del Mar Formation to the coarser tan-orange sandstones of the Torrey Sandstone (Fig. 2-1). Figure 2-1. View north where the bluffs begin at Del Mar dog beach. The Del Mar Formation contains several lagoon paleoenvironmental indicators (Fig. 2-2). Physical sedimentary structures include mud cracks and ripple cross-bedding. Oyster beds are common, forming resistant ledges that stand up to wave erosion. (Calcium carbonate mobilized from the oyster shells probably causes the harder cementation.) Coal is found as discreet pods or lenses that probably represent branches or logs. Halos of yellowish sulfur often surround the coal. Burrows, probably of marine worms or crustaceans, are abundant. The burrows stand out best where a grain size contrast exists between burrows and surrounding sediment. (Burrows originally dug in mud or muddy sand are often filled with coarser sand piped in from overlying beds.) Figure 2-2. Features indicating lagoon paleoenvironments in the Eocene Del Mar Formation. a) Oysters and a thin lens of coal. b) Burrows (probably crustacean) in muddy sandstone. c) Polygonal mud cracks on a bedding plane (oblique view from below). Continue north to where a white picket fence teeters at the top of the bluff. For the rest of the walk, we will focuses on geologic factors involved in bluff erosion, and associated mitigation efforts. Site 2-3: Picket fence (GPS N32.978479° W117.271861°) to Pets Prohibited sign. The bluffs from the picket fence north to the “Pets Prohibited” sign display numerous joints and faults, oriented near vertical and striking NE into the bluff face. (Joints are fractures where the rocks have not experienced any displacement, whereas faults are fractures with measurable displacement.) Both joints and faults form zones of weakness exploited by waves, as shown by the development of sea caves at these locations (Fig. 2-3a). The most striking example of fault-controlled erosion occurs about 100 yards south of the “Pets Prohibited” sign, where a chain link fence hangs out into space at the bluff top. A collapse zone has developed here along a fault that strikes NE and dips steeply NW (Fig. 2-3b). The fault brings the Torrey Sandstone down to beach level on the north side. We will see no more Del Mar Formation north of here, only Torrey Sandstone and Bay Point Formation. Continue north to the “Pets Prohibited” sign. Figure 2-3. Examples of how wave attack exploits joints and faults in coastal bluffs. a) Sea caves formed along joints in the Torrey Sandstone. b) Retreat of the bluff along a fault, with the fault plane partially exposed. (This is a normal fault with the left (hanging wall) side down.) Site 2-4: Pets Prohibited sign (GPS N32.980270° W117.272458°) to riprap point. The weakly cemented Bay Point Formation forms most of the bluff from here north to the riprap point. The long seawall (Fig. 2-4) was built in the 1970s—two decades before the California Coastal Commission (CCC) mandated a “naturalistic” look for seawalls in 1994 (California Coastal Commission, 1994). We will see examples of modern seawalls later. Figure 2-4. 1970s seawall and riprap at Site 2-4. The riprap that protects the point where the stairs come down to the beach (Fig. 2-4) was placed during the 1970s. As a bluff protection method, riprap has two advantages over a seawall: it is considerably cheaper, and it dissipates wave energy well. (The second factor makes riprap especially effective for protecting protruding points of land.) Riprap’s disadvantages are that it is ugly and takes up public beach space. The CCC would probably not permit riprap placement on this beach today. Continue north from the riprap point to the long seawall that is concave to the beach. The Torrey Sandstone bluffs from here north display beautiful large-scale cross-bedding. Numerous faults and joints cut the sandstone. Waves have opened up sea caves along these zones of weakness. Most caves have been filled in with cement (Fig. 2-5a). Continue north to the access steps at Seascape Surf. Figure 2-5. a) Cement plugs (arrows) filling in multiple sea caves in the Torrey Sandstone. b) This plug once filled a sea cave, but as the sandstone bluffs have retreated, the plug has been left behind. (Both images are south of the beach access steps at Seascape Surf.) Stop 2-5: Steps at Seascape Surf (GPS N32.985545° W117.273395°) Here we see many examples of cement plugs filling sea caves. The plugs were originally probably poured in the 1970s. The Torrey Sandstone is softer than the cement plugs, and so as waves erode the bluff, the cement plugs stick out from the bluff face (Fig. 2-5b). Notice the greater erosion on the north sides of some plugs. This reflects the dominant northwest swell direction—the same process that causes net southward longshore drift along the shoreline. Based on precision laser-measurements of the bluffs in the Oceanside Littoral Cell from 1998 to 2004, Young and Ashford (2006) estimate an average annual bluff retreat rate of 8.0 cm/year. However, bluff retreat is highly episodic. The upper bluff may stay stable for many years, but undercutting and sea cave formation at the bluff base (if unchecked) may eventually cause catastrophic collapse. Using aerial photographs and railroad surveys extending back to the 1880s, Kuhn and Shepard (1984) document extreme variability in bluff erosion rates. Much urban development of the bluff tops took place from the 1950s to early 1970s—by coincidence a period of relative bluff stability. To quote from Kuhn and Shepard (1984, p166): “Consolidated sea cliffs, such as well-cemented sandstone, often give a false appearance of long-term stability. Cliff erosion in sandstone, for the most part, is episodic, where long periods of little change may be followed by large landslides, causing many feet of retreat in a short time.” Continue north from the steps at Seascape Surf. About half way between these steps and the next set of steps, a thick bed of gray shale (a shale lens within the Torrey Sandstone) appears in the bluff face. Wave erosion of the soft shale has caused noticeable bluff retreat. Cement now veneers part of the shale bed. The erosion here is an example of lithologic (as opposed to structural; i.e. joints and faults) control on bluff retreat. A few yards north of the shale bed, a set of steps descends to the beach. Here we see our first example of a “naturalistic” sea wall designed to blend in with the natural bluff. Continue north a few hundred yards to the much larger and longer naturalistic seawall. Stop 2-6: Large naturalistic seawall (GPS N32.989255° W117.274116°) In 1994, the CCC mandated that seawalls be designed for minimal visual impact (California Coastal Commission, 1994). (In other words, no more ugly, prison-style cement walls allowed on the beach.) The mandate recognizes that the beach is a public space, and that the public’s experience is negatively affected by non-naturalistic armoring structures. The goal of naturalistic construction is to mimic the color and texture of the natural bluff (Fig. 2-6). Continue north to Fletcher Cover. An access ramp leads from the beach up to the parking lot where we will meet the bus. Go past the access ramp to the north side of the cove. Stop 2-7: Fletcher Cove, north side (GPS N32.991875° W117.274526°) The cove at Fletcher Cove exists because of a change in bluff lithology. Within the cove, the bluffs are made of weakly cemented sandstone and shale, whereas resistant Torrey Sandstone forms the bluffs north and south of the cove. An exposure on the north side of the cove (Fig. 27) shows a contact between the Torrey Sandstone (north side) and the weaker sandstone-shale beds (south side). We are unsure about the nature of this contact. It may be a fault, or it may represent depositional fill against a paleo-valley wall. Either way, the result has been to juxtapose rock units of differing resistance to wave attack, caused distinct differences in bluff retreat. This is an example of lithologic (as opposed to structural) control on bluff retreat. Go up the access ramp to the picnic area. Here we will have lunch before getting on the bus to go to STOP 3. Figure 2-6. Example of a “naturalistic” seawall—a design feature mandated by the California Coastal Commission to minimize the negative aesthetic impact of seawalls. Figure 2-7. Previous examples illustrated how joints and faults become the focus of wave attack on coastal bluffs. At Fletcher Cove, a change in lithology, rather than joints or faults, controls wave erosion. Here the resistant Torrey Sandstone (on the left (north) side) occurs in contact with weakly cemented shale and sandstone (stratigraphic affinity uncertain, but younger than the Torrey Sandstone). Consequently, the bluffs have retreated here to create the cove of Fletcher Cove.


![PERSONAL COMPUTERS CMPE 3 [Class # 20524]](http://s2.studylib.net/store/data/005319327_1-bc28b45eaf5c481cf19c91f412881c12-300x300.png)
