Activity 7a
advertisement

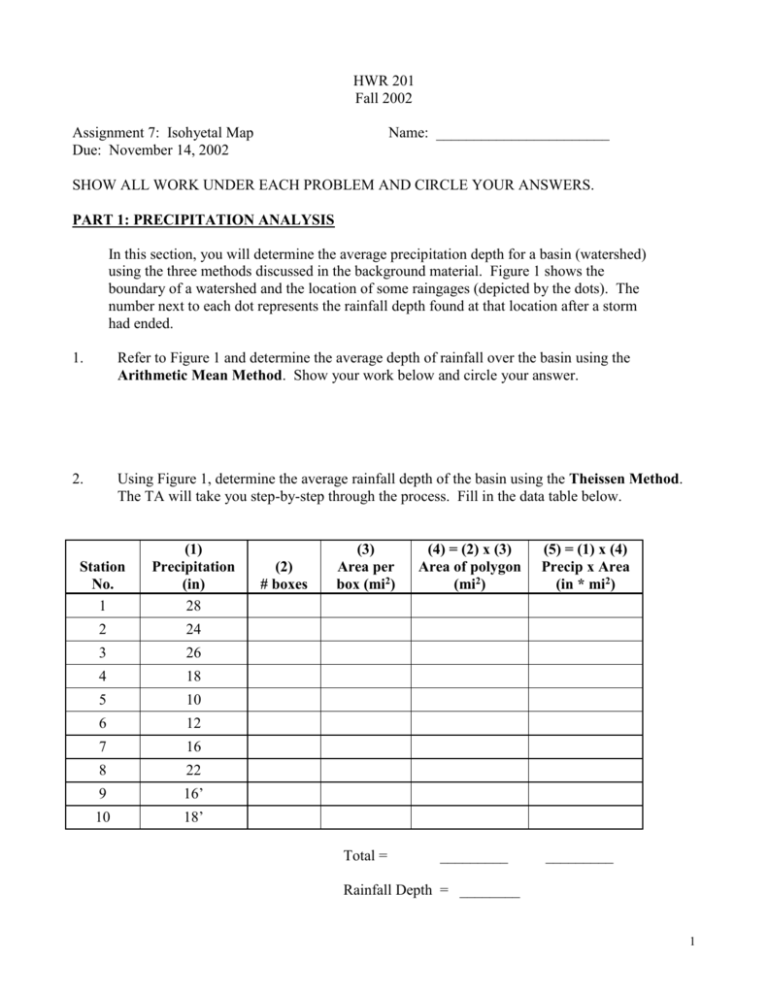
HWR 201 Fall 2002 Assignment 7: Isohyetal Map Due: November 14, 2002 Name: _______________________ SHOW ALL WORK UNDER EACH PROBLEM AND CIRCLE YOUR ANSWERS. PART 1: PRECIPITATION ANALYSIS In this section, you will determine the average precipitation depth for a basin (watershed) using the three methods discussed in the background material. Figure 1 shows the boundary of a watershed and the location of some raingages (depicted by the dots). The number next to each dot represents the rainfall depth found at that location after a storm had ended. 1. Refer to Figure 1 and determine the average depth of rainfall over the basin using the Arithmetic Mean Method. Show your work below and circle your answer. 2. Using Figure 1, determine the average rainfall depth of the basin using the Theissen Method. The TA will take you step-by-step through the process. Fill in the data table below. Station No. 1 (1) Precipitation (in) 28 2 24 3 26 4 18 5 10 6 12 7 16 8 22 9 16’ 10 18’ (2) # boxes (3) Area per box (mi2) (4) = (2) x (3) Area of polygon (mi2) Total = _________ (5) = (1) x (4) Precip x Area (in * mi2) _________ Rainfall Depth = ________ 1 3. Determine the average rainfall depth of the basin using the Isohyetal Method. Use Figure 2, which includes some extra raingage stations. a) b) Draw 5 inch isohyets and label them with their values. Look at the values of the isohyets and the relative areas covered between each. Just looking at the map, estimate what you think the average rainfall depth is for the basin and write it below. Eyeball estimate of rainfall depth = ________ c) Fill in the data table below. Representing Isohyets Between… (1) Average Isohyet (inches) Watershed boundary and 5” 5” and 10” ≤5 10” and 15” 12.5 (2) # Boxes Between Isohyets (3) Area per box (mi2) (4) = (2) x (3) Area Between Isohyets (mi2) (5) = (1) x (4) Avg Isohyet x Area (in * mi2) 7.5 15” and 20” 20” and 25” 25” and 30” 30” and watershed boundary ≥ 30 Total = _________ _________ Rainfall Depth = ________ 4. Briefly discuss the advantages and disadvantages in maintaining a dense network of recording raingages for a given watershed. How would maintaining a dense, or sparse network of raingages throughout a watershed affect your ability to estimate the average rainfall depth for that watershed? Considering such things as variation in topography, variation in rainfall intensity during storms, size of a watershed, useful of the information, and cost. 2 PART 2: APPLICATION 1) Using the Rational Formula (Q = CIA), determine the peak discharge for a 60 minute storm with a return period of 10 years (see Figure 3.5 attached) and a C = 0.50 for a 640 acre basin. 2) A. Using Figure 3.5, determine the return period for a storm of 60 minute duration with an intensity of 4 in/hr. B. If a basin of 400 acres has a C = 0.80 and the above intensity, what would the discharge value be in cfs? 3) Answer the following conceptual questions. a) What is an isohyet? b) List the most common forms of precipitation in order from smallest to largest size and briefly describe each. c) What is the difference between sleet and hail? d) What is orographic precipitation/how is orographic precipitation produced? e) What conditions are necessary to produce a thunderstorm? f) What are some errors in measurement when using a standard rain gage? 3 4 5


