- World of Inclusion
advertisement

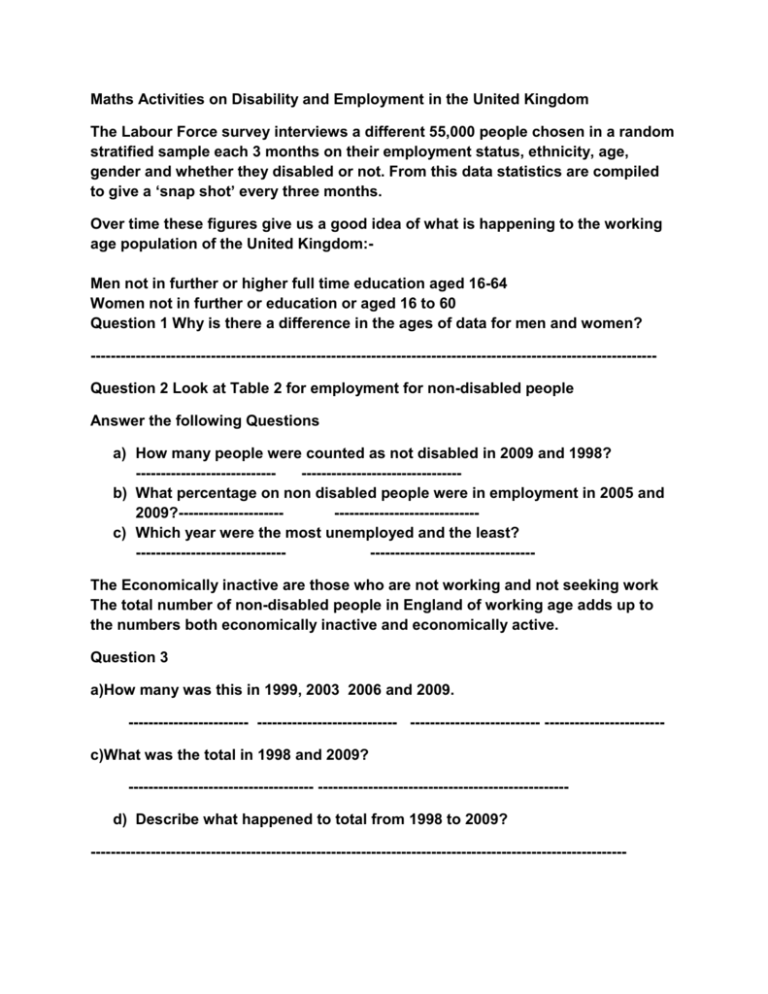
Maths Activities on Disability and Employment in the United Kingdom The Labour Force survey interviews a different 55,000 people chosen in a random stratified sample each 3 months on their employment status, ethnicity, age, gender and whether they disabled or not. From this data statistics are compiled to give a ‘snap shot’ every three months. Over time these figures give us a good idea of what is happening to the working age population of the United Kingdom:Men not in further or higher full time education aged 16-64 Women not in further or education or aged 16 to 60 Question 1 Why is there a difference in the ages of data for men and women? ----------------------------------------------------------------------------------------------------------------Question 2 Look at Table 2 for employment for non-disabled people Answer the following Questions a) How many people were counted as not disabled in 2009 and 1998? ----------------------------------------------------------b) What percentage on non disabled people were in employment in 2005 and 2009?------------------------------------------------c) Which year were the most unemployed and the least? -------------------------------------------------------------The Economically inactive are those who are not working and not seeking work The total number of non-disabled people in England of working age adds up to the numbers both economically inactive and economically active. Question 3 a)How many was this in 1999, 2003 2006 and 2009. ------------------------ ---------------------------- -------------------------- -----------------------c)What was the total in 1998 and 2009? ------------------------------------- -------------------------------------------------d) Describe what happened to total from 1998 to 2009? ----------------------------------------------------------------------------------------------------------- Now look at Table 1. This gives the same information for disabled people in England. People were asked if they had ill health or an impairment for 12 months or more and or health conditions that limit their ability to work ( See Definition sheet for more detail). Question 4 a) What were the total number of disabled people in the UK of working age in i) 1998---------------ii) 2001---------------iii) 2003---------------iv) 2005---------------v) 2009---------------b) How many more disabled had a job in 2009 than in 1998?-------------------------c) What was the level of economic activity for disabled people in 1998 and 2009______________ ___________________ d) Are b and c measuring the same thing and why?--------------------------------------- -------------------------------------------------------------------------------------------------Question 5 On a piece of graph paper plot the numbers in employment for Table 2 non disabled and disabled people. The x or vertical axes should be in millions The y or horizontal axis should be in years. Use 1 centimetre on y axes for each year. Use 1 centimetre for every million people on the x axis. Add Title Graph Employment for disabled and non-disabled people in the UK 1998-2009. Label your axes and join up the two sets of dots with different coloured lines. Question 6 Describe the trends shown by your graph. --------------------------------------------------------------------------------------------------------------------------------------------------------------------------------------------------------------------------------------------------------------------------------------------------------------------------------------------------------------------------------------------------------------------------------------------------------------------------------------------------------------------------------------------------------------- Maths and Disability II Examine Table 3 which gives the employment figures for disabled people from 1998 to 2009. Draw a bar chart to show percentage economically active and inactive for 19982009-12 years. Put percentage on x axis and years on y axis. Describe the pattern of the graph. Can you think of three reasons for the changes shown in your graph. Examine Table 4 This give a break down of the main impairing condition in 2002 and 2008. Describe three big changes from 2002 to 2008. Not all groups have the same employment rates which three impairment groups are lowest and which three highest. Are these the same in 2002 and 2008. Why do you think there are these differences. Is it because some disabled people cannot do the work or that employers are not prepared to hire people in some groups? Examine Table 5 Age and Gender differences. Draw a pie chart for Men and Women by their age groups. Multiply each percentage figure by 3.6 to give you the size of the pieces of the pie. Use a a pair of compasses to draw the circle. Place ruler on centre point and draw a vertical line at 12.00 . Then lay protractor on this line and mark off degrees. Remembering 360 degrees in circle. The pieces of the pie should fill the circle. Now comment on the pattern by age for numbers who are disabled. Is there any difference between men and women. Have a class discussion about all you have found out about employment and disability. In a world without discrimination and adjustments for disabled people there should not be big differences in employment rates between disabled and nondisabled people. In groups prepare a presentation using the graphs and data you have been provided to make a 8 minute presentation on the position of disabled people and employment. You may also want to read the attached Fact Sheet on Disability and Employment. End your presentation with a charter of what should change to bring about equality for disabled people in employment.


