Assignment #6
advertisement
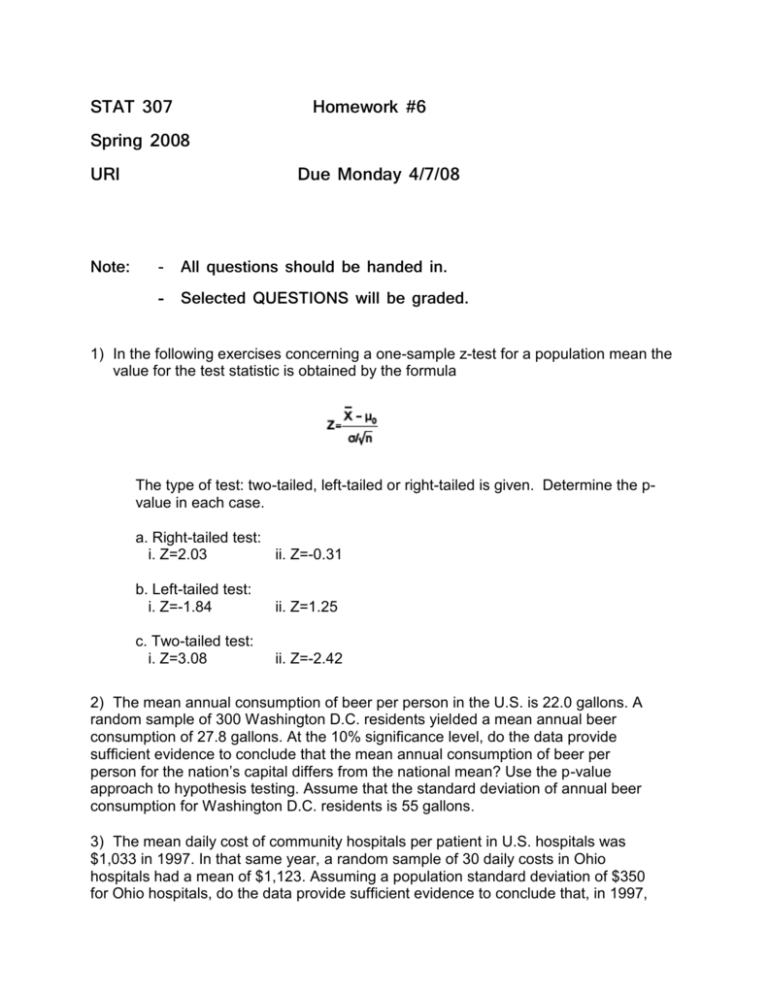
STAT 307 Homework #6 Spring 2008 URI Note: Due Monday 4/7/08 - All questions should be handed in. - Selected QUESTIONS will be graded. 1) In the following exercises concerning a one-sample z-test for a population mean the value for the test statistic is obtained by the formula The type of test: two-tailed, left-tailed or right-tailed is given. Determine the pvalue in each case. a. Right-tailed test: i. Z=2.03 ii. Z=-0.31 b. Left-tailed test: i. Z=-1.84 ii. Z=1.25 c. Two-tailed test: i. Z=3.08 ii. Z=-2.42 2) The mean annual consumption of beer per person in the U.S. is 22.0 gallons. A random sample of 300 Washington D.C. residents yielded a mean annual beer consumption of 27.8 gallons. At the 10% significance level, do the data provide sufficient evidence to conclude that the mean annual consumption of beer per person for the nation’s capital differs from the national mean? Use the p-value approach to hypothesis testing. Assume that the standard deviation of annual beer consumption for Washington D.C. residents is 55 gallons. 3) The mean daily cost of community hospitals per patient in U.S. hospitals was $1,033 in 1997. In that same year, a random sample of 30 daily costs in Ohio hospitals had a mean of $1,123. Assuming a population standard deviation of $350 for Ohio hospitals, do the data provide sufficient evidence to conclude that, in 1997, 2 the mean daily cost in Ohio hospitals exceeded the national mean of $1,033. Perform the required hypothesis test at the 5% significance level. Use the p-value approach to hypothesis testing. 4) For a t-curve with df=17, use the t-table to find each t-value a. t0.05 b. t0.025 c. t0.01 3 5) Because many industrial wastes contain nutrients than enhance crop growth, efforts are being made for environmental purposes to use such wastes on agricultural soils. Two researchers reported their findings on experiments with brewery wastes used for agricultural purposes in an article published in Environmental Polution (Series A), 33, pp.341-351. The researchers studied the physico-chemical properties of effluent from Mohan Meakin Breweries Ltd (MMBL) in India. They assessed the impact of using different concentrations of the effluent: 25%, 50%, 75% and 100%. The following data provide the percentages of limestone in the soil obtained by using 100% effluent: 2.41 2.31 2.54 2.28 2.72 2.60 2.51 2.51 2.42 2.70 Assume the population you are sampling from is fairly normal. a. Find a 99% confidence interval for the mean available limestone in soil treated with 100% MMBL effluent and interpret the interval. b. Using the confidence interval found above, does it appear that the mean available limestone in soil treated with 100% MMBL effluent exceeds 2.30%, the percentage ordinarily found? Explain. 6) Using the data in this question (5), do the data provide sufficient evidence to conclude, at the 1% significance level, that the mean available limestone in soil treated with 100% MMBL effluent exceeds 2.30%, the percentage ordinarily found? That is, answer part (b) in this question but using a hypothesis testing approach. 7) Using the data in question (5) use Excel to find the 90% confidence interval for the mean available limestone in soil treated with 100% MMBL effluent. Hand in the Excel printout and write the upper and lower limits for the interval in the same printout. Show how the limits are obtained and interpret the interval.

