Dog Bites Correlate Strongly with Meteorological Variables
advertisement

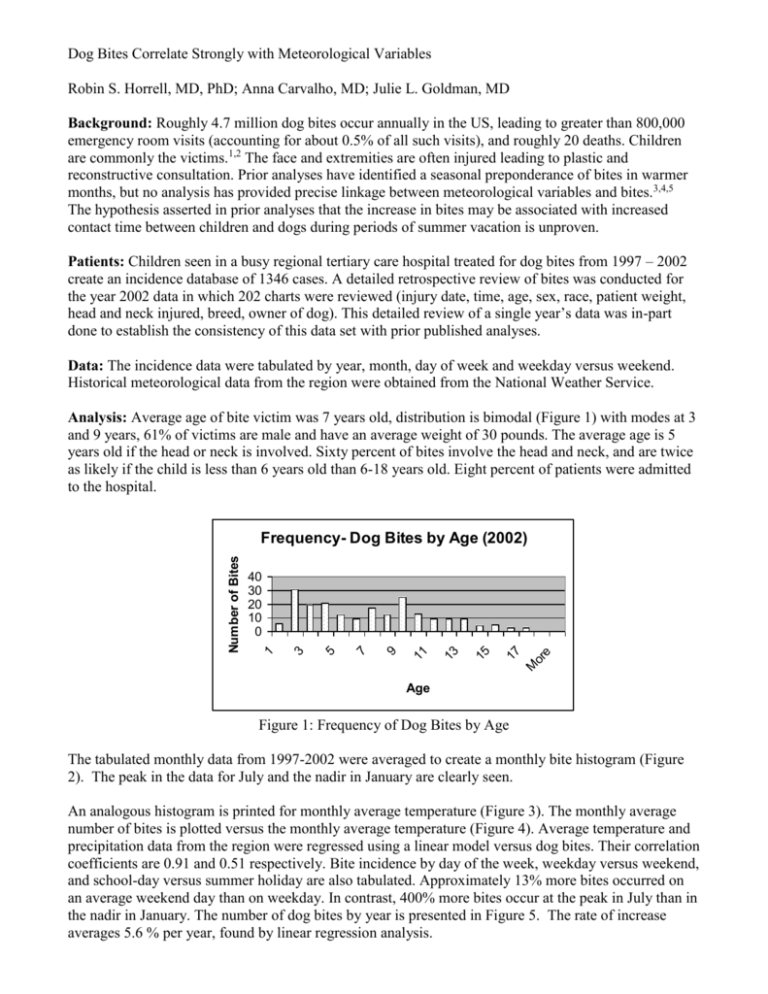
Dog Bites Correlate Strongly with Meteorological Variables Robin S. Horrell, MD, PhD; Anna Carvalho, MD; Julie L. Goldman, MD Background: Roughly 4.7 million dog bites occur annually in the US, leading to greater than 800,000 emergency room visits (accounting for about 0.5% of all such visits), and roughly 20 deaths. Children are commonly the victims.1,2 The face and extremities are often injured leading to plastic and reconstructive consultation. Prior analyses have identified a seasonal preponderance of bites in warmer months, but no analysis has provided precise linkage between meteorological variables and bites.3,4,5 The hypothesis asserted in prior analyses that the increase in bites may be associated with increased contact time between children and dogs during periods of summer vacation is unproven. Patients: Children seen in a busy regional tertiary care hospital treated for dog bites from 1997 – 2002 create an incidence database of 1346 cases. A detailed retrospective review of bites was conducted for the year 2002 data in which 202 charts were reviewed (injury date, time, age, sex, race, patient weight, head and neck injured, breed, owner of dog). This detailed review of a single year’s data was in-part done to establish the consistency of this data set with prior published analyses. Data: The incidence data were tabulated by year, month, day of week and weekday versus weekend. Historical meteorological data from the region were obtained from the National Weather Service. Analysis: Average age of bite victim was 7 years old, distribution is bimodal (Figure 1) with modes at 3 and 9 years, 61% of victims are male and have an average weight of 30 pounds. The average age is 5 years old if the head or neck is involved. Sixty percent of bites involve the head and neck, and are twice as likely if the child is less than 6 years old than 6-18 years old. Eight percent of patients were admitted to the hospital. or e M 17 15 13 11 9 7 5 3 40 30 20 10 0 1 Number of Bites Frequency- Dog Bites by Age (2002) Age Figure 1: Frequency of Dog Bites by Age The tabulated monthly data from 1997-2002 were averaged to create a monthly bite histogram (Figure 2). The peak in the data for July and the nadir in January are clearly seen. An analogous histogram is printed for monthly average temperature (Figure 3). The monthly average number of bites is plotted versus the monthly average temperature (Figure 4). Average temperature and precipitation data from the region were regressed using a linear model versus dog bites. Their correlation coefficients are 0.91 and 0.51 respectively. Bite incidence by day of the week, weekday versus weekend, and school-day versus summer holiday are also tabulated. Approximately 13% more bites occurred on an average weekend day than on weekday. In contrast, 400% more bites occur at the peak in July than in the nadir in January. The number of dog bites by year is presented in Figure 5. The rate of increase averages 5.6 % per year, found by linear regression analysis. Average Dog Bites/Month Kosair Children's Hospital (1997-2002) n Ju l Au g Se p O ct N ov D ec Ju r ay M b ar Ap Jan Feb Mar Apr May Jun Jul Aug Sep Oct Nov Dec Fe Ja n 14.7 17.3 17.3 23.3 27.2 25.7 25.5 20.2 11.8 0 17.5 10 14.0 20 10.0 Bites 30 100 80 60 40 20 0 M Degrees (F) Daily Average Temperature Month Month Figure 2: Average Dog Bites per Month Figure 3: Average Temperature by Month Number of Dog Bites/Year KCH 300 30 25 Number Dog bite s /Month A v g B ite s v s . A v g T e m p e ra tu re 20 15 10 5 30 40 50 60 70 80 A v e r a g e T e m p e r a tu r e b y M o n th (d e g F ) Figure 4: Dog Bites versus Temperature 250 200 182 150 1997 198 1998 242 220 1999 2000 259 2001 245 2002 Year Figure 5: Annual Bite Trend Conclusions: Annually dog bites follow a distinctly cyclical pattern, correlating strongly with increasing temperature and with increasing precipitation. Bites are increasing annually by 5.6% in this region over the study period, an alarming rate from a public health perspective. The difference between bites during the week versus weekends nominally favors an increase on the weekend, and therefore only minimally supports the supposition that children are bitten more when they are off from school. This ratio remained relatively constant regardless of season. This small percentage difference does not account for the nearly 4-fold increase in bite frequency that is actually observed between the Winter and Summer months. Clearly the circumstances leading up to an individual bite incident are complex, and this analysis suggests the factors go beyond the simplistic concept that the availability of children to interact with a dog determines the probability of a bite. It is interesting to consider whether the “frame of mind”, i.e. aggressiveness of some dogs may be altered by meteorological factors. Finally, the detailed data from 2002 compares well with other literature reports, suggesting the temperature and precipitation correlation may generalize to other locations or regions. The data presented may be useful in implementing bite prevention strategies through increased public awareness. The plastic and reconstructive surgeon can use this information to anticipate the cyclic flux of bite-related consultations in regions with varying seasonal temperatures, and to a lesser extent precipitation. References: 1. CDC. Nonfatal dog bite-related injuries treated in hospital emergency departments-United States, 2001. MMWR Morb Mortal Wkly Rep. 2003;52(26):605-610. 2. Weiss HB, Friedman DI, Coben JH: Incidence of dog bite injuries treated in emergency departments. JAMA. 1998;279(1):51-53. 3. Avner JR, Baker MD: Dog bites in urban children. Pediatrics. 1991;88(1):55-57. 4. Gandhi RR, Liebman MA, Stafford BL, et al: Dog bite injuries in children: a preliminary survey. Am Surg. 1999;65(9):863-864. 5. Borud LJ, Friedman DW: Dog bites in New York City. Plast Reconstr Surg. 2000;106(5):987990.


