Hands-on Statistics
advertisement
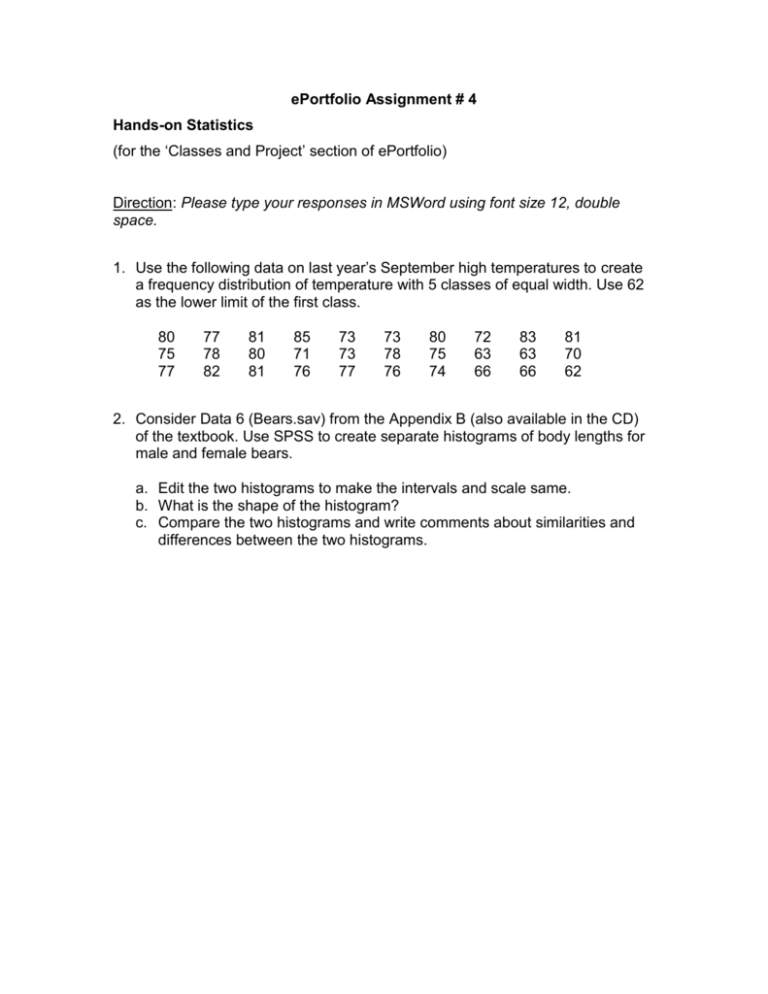
ePortfolio Assignment # 4 Hands-on Statistics (for the ‘Classes and Project’ section of ePortfolio) Direction: Please type your responses in MSWord using font size 12, double space. 1. Use the following data on last year’s September high temperatures to create a frequency distribution of temperature with 5 classes of equal width. Use 62 as the lower limit of the first class. 80 75 77 77 78 82 81 80 81 85 71 76 73 73 77 73 78 76 80 75 74 72 63 66 83 63 66 81 70 62 2. Consider Data 6 (Bears.sav) from the Appendix B (also available in the CD) of the textbook. Use SPSS to create separate histograms of body lengths for male and female bears. a. Edit the two histograms to make the intervals and scale same. b. What is the shape of the histogram? c. Compare the two histograms and write comments about similarities and differences between the two histograms.
