Estimation with Stratified Random Sampling
advertisement
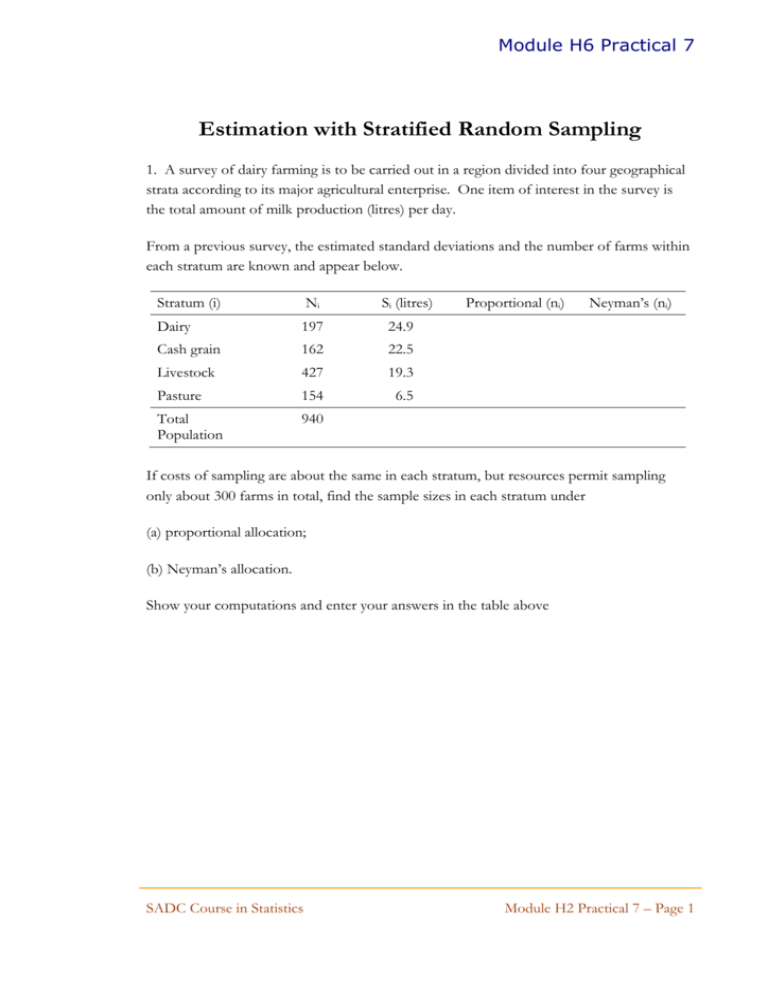
Module H6 Practical 7 Estimation with Stratified Random Sampling 1. A survey of dairy farming is to be carried out in a region divided into four geographical strata according to its major agricultural enterprise. One item of interest in the survey is the total amount of milk production (litres) per day. From a previous survey, the estimated standard deviations and the number of farms within each stratum are known and appear below. Stratum (i) Ni Si (litres) Dairy 197 24.9 Cash grain 162 22.5 Livestock 427 19.3 Pasture 154 6.5 Total Population 940 Proportional (ni) Neyman’s (ni) If costs of sampling are about the same in each stratum, but resources permit sampling only about 300 farms in total, find the sample sizes in each stratum under (a) proportional allocation; (b) Neyman’s allocation. Show your computations and enter your answers in the table above SADC Course in Statistics Module H2 Practical 7 – Page 1 Module H6 Practical 7 2. A district has 2072 farms which have been divided up into five strata on the basis of area in acres. The table below (also available in the Excel worksheet cattle, in file H6_data.xls) gives the number Ni of farms in a stratum, the size ni of the simple random sample of farms taken n each stratum, the mean number of cattle per farm for each stratum and the stratum variances of number of cattle per farm. This is of course a summary of the raw data which consists of 500 observations (farms), and cattle numbers in each farm. Stratum (i) Ni ni xi si2 16 635 84 4.24 27.54 >16 to 30 570 125 11.63 55.84 >30 to 50 475 138 15.95 71.70 >51 to 75 303 112 23.59 192.32 89 41 29.61 334.93 2072 500 >75 Totals (a) Estimate the mean number of cattle per farm and the total number of cattle in the district. (b) Calculate the standard error of the above two estimates and determine 95% confidence intervals for both. (c) Interpret your results and comment on the precision of your sample estimates. Also comment on whether you would have had lower precision had you taken a simple random sample instead of 500 farms. Explain your answer. SADC Course in Statistics Module H2 Practical 7 – Page 2 Module H6 Practical 7 3. Following an immunisation campaign, a survey was carried out in a rural area with 5 villages (strata) by selecting a simple random sample of 10 children aged 1 to 2 years from each village and asking their parents about the child’s vaccination status. The data were as follows: Village (i) Total number of children aged 1-2 years Number vaccinated in selected sample 1 22 5 2 65 7 3 28 4 4 25 8 5 43 2 Total 183 (a) Estimate the proportion of children aged 1-2 in the area who have been vaccinated. (b) Find also the standard error of your estimate and hence derive a 95% confidence interval for the true proportion of children aged 1-2 who have been vaccinated. (c) Comment on the results and the effectiveness of the immunisation campaign. SADC Course in Statistics Module H2 Practical 7 – Page 3
