(1) What information is provided by the numerical value of the
advertisement

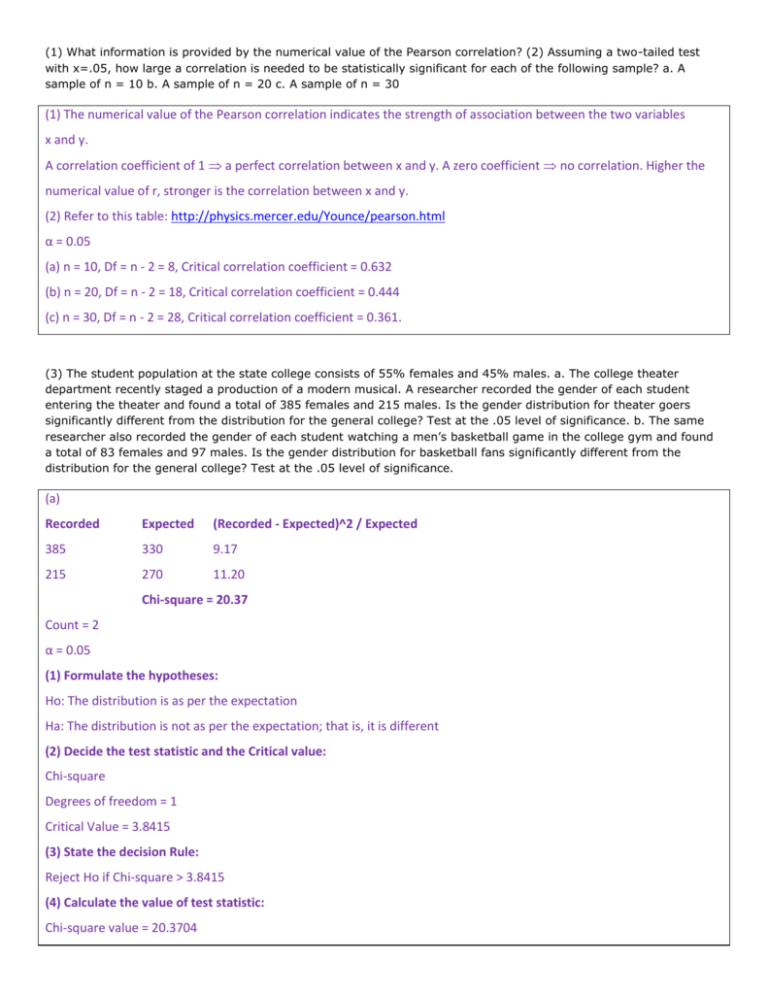
(1) What information is provided by the numerical value of the Pearson correlation? (2) Assuming a two-tailed test with x=.05, how large a correlation is needed to be statistically significant for each of the following sample? a. A sample of n = 10 b. A sample of n = 20 c. A sample of n = 30 (1) The numerical value of the Pearson correlation indicates the strength of association between the two variables x and y. A correlation coefficient of 1 a perfect correlation between x and y. A zero coefficient no correlation. Higher the numerical value of r, stronger is the correlation between x and y. (2) Refer to this table: http://physics.mercer.edu/Younce/pearson.html α = 0.05 (a) n = 10, Df = n - 2 = 8, Critical correlation coefficient = 0.632 (b) n = 20, Df = n - 2 = 18, Critical correlation coefficient = 0.444 (c) n = 30, Df = n - 2 = 28, Critical correlation coefficient = 0.361. (3) The student population at the state college consists of 55% females and 45% males. a. The college theater department recently staged a production of a modern musical. A researcher recorded the gender of each student entering the theater and found a total of 385 females and 215 males. Is the gender distribution for theater goers significantly different from the distribution for the general college? Test at the .05 level of significance. b. The same researcher also recorded the gender of each student watching a men’s basketball game in the college gym and found a total of 83 females and 97 males. Is the gender distribution for basketball fans significantly different from the distribution for the general college? Test at the .05 level of significance. (a) Recorded Expected (Recorded - Expected)^2 / Expected 385 330 9.17 215 270 11.20 Chi-square = 20.37 Count = 2 α = 0.05 (1) Formulate the hypotheses: Ho: The distribution is as per the expectation Ha: The distribution is not as per the expectation; that is, it is different (2) Decide the test statistic and the Critical value: Chi-square Degrees of freedom = 1 Critical Value = 3.8415 (3) State the decision Rule: Reject Ho if Chi-square > 3.8415 (4) Calculate the value of test statistic: Chi-square value = 20.3704 (5) Compare with the critical value and make a decision: Since 20.3704 > 3.8415 we reject Ho and accept Ha Decision: It appears that the distribution is not as per the expectation; that is, it is different. (b) Recorded Expected (Recorded - Expected)^2 / Expected 83 99 2.59 97 81 3.16 Chi-square = 5.75 Count = 2 α = 0.05 (1) Formulate the hypotheses: Ho: The distribution is as per the expectation Ha: The distribution is not as per the expectation; that is, it is different (2) Decide the test statistic and the Critical value: Chi-square Degrees of freedom = 1 Critical Value = 3.8415 (3) State the decision Rule: Reject Ho if Chi-square > 3.8415 (4) Calculate the value of test statistic: Chi-square value = 5.7464 (5) Compare with the critical value and make a decision: Since 5.7464 > 3.8415 we reject Ho and accept Ha Decision: It appears that the distribution is not as per the expectation; that is, it is different.


