Vertical Analysis
advertisement
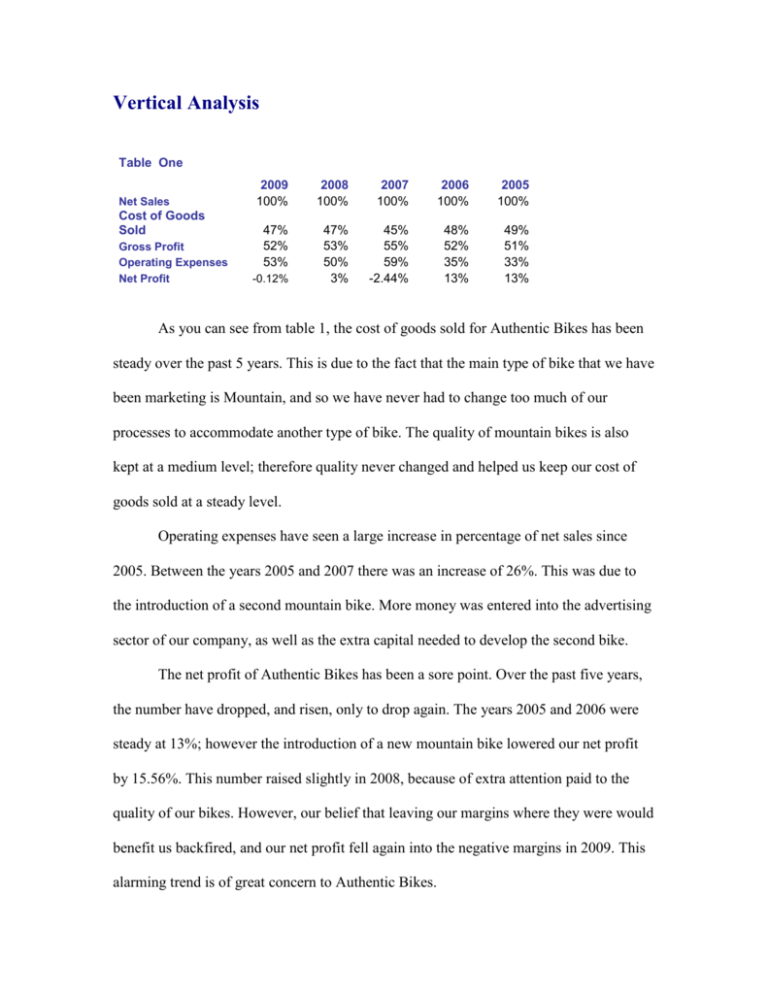
Vertical Analysis Table One Net Sales Cost of Goods Sold Gross Profit Operating Expenses Net Profit 2009 100% 2008 100% 2007 100% 2006 100% 2005 100% 47% 52% 53% 47% 53% 50% 3% 45% 55% 59% -2.44% 48% 52% 35% 13% 49% 51% 33% 13% -0.12% As you can see from table 1, the cost of goods sold for Authentic Bikes has been steady over the past 5 years. This is due to the fact that the main type of bike that we have been marketing is Mountain, and so we have never had to change too much of our processes to accommodate another type of bike. The quality of mountain bikes is also kept at a medium level; therefore quality never changed and helped us keep our cost of goods sold at a steady level. Operating expenses have seen a large increase in percentage of net sales since 2005. Between the years 2005 and 2007 there was an increase of 26%. This was due to the introduction of a second mountain bike. More money was entered into the advertising sector of our company, as well as the extra capital needed to develop the second bike. The net profit of Authentic Bikes has been a sore point. Over the past five years, the number have dropped, and risen, only to drop again. The years 2005 and 2006 were steady at 13%; however the introduction of a new mountain bike lowered our net profit by 15.56%. This number raised slightly in 2008, because of extra attention paid to the quality of our bikes. However, our belief that leaving our margins where they were would benefit us backfired, and our net profit fell again into the negative margins in 2009. This alarming trend is of great concern to Authentic Bikes.
