Census-2011-Preliminary-Report
Census 2011 Preliminary Report
Findings for County Cavan
Population
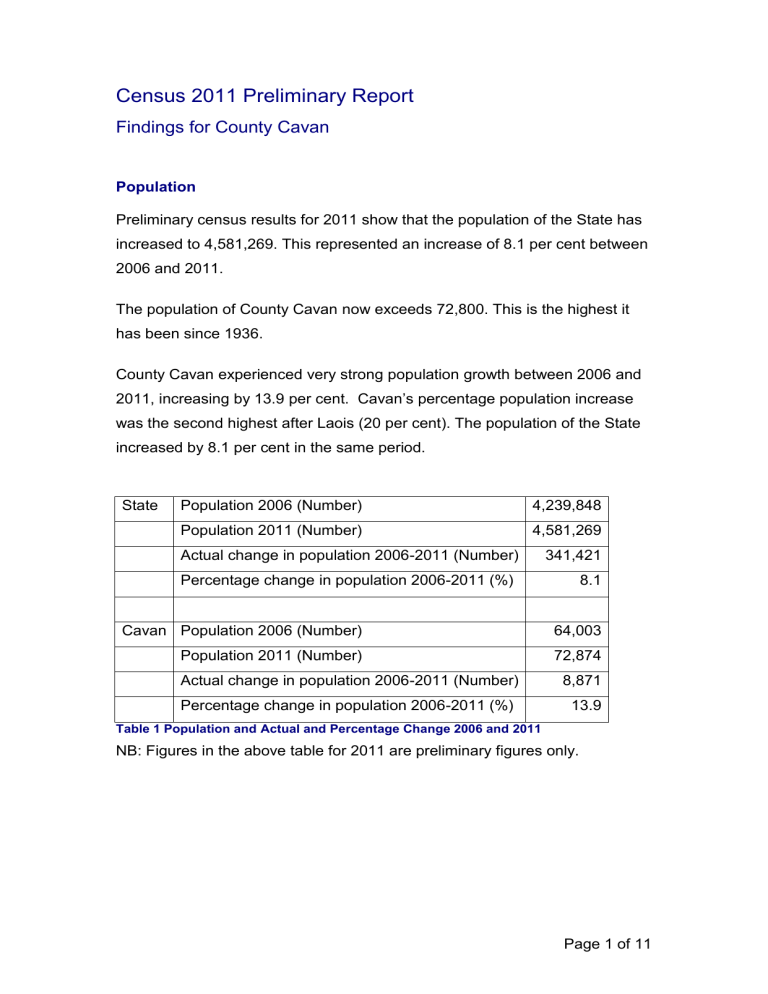
Preliminary census results for 2011 show that the population of the State has increased to 4,581,269. This represented an increase of 8.1 per cent between
2006 and 2011.
The population of County Cavan now exceeds 72,800. This is the highest it has been since 1936.
County Cavan experienced very strong population growth between 2006 and
2011, increasing by 13.9 per cent . Cavan’s percentage population increase was the second highest after Laois (20 per cent). The population of the State increased by 8.1 per cent in the same period.
State Population 2006 (Number) 4,239,848
Population 2011 (Number)
Actual change in population 2006-2011 (Number)
Percentage change in population 2006-2011 (%)
4,581,269
341,421
8.1
Cavan Population 2006 (Number)
Population 2011 (Number)
64,003
72,874
Actual change in population 2006-2011 (Number) 8,871
Percentage change in population 2006-2011 (%) 13.9
Table 1 Population and Actual and Percentage Change 2006 and 2011
NB: Figures in the above table for 2011 are preliminary figures only.
Page 1 of 11
All eight NUTS3 regions recorded population growth over the 2006 to 2011 intercensal period. The Midlands (12.1%), Mid-East (11.6%) and Border (9.8%) regions recorded the strongest population growth with the lowest rate recorded in the
Mid-West region (4.8%).
County Cavan Population
The majority (80%) of the 93 Electoral Divisions in Cavan experienced an increase in population from 2006. Cavan Urban ED however experienced a decline of 8% (327 people).
Electoral Division
Cavan Rural
Mullagh
Ballyjamesduff
Tircahan
Kilinkere
ButlersBridge
Percentage Increase
47.2
39.6
36.9
34.4
31.5
28.6
Kilconny 26.6
Kingscourt
Diamond
25.2
23.5
Table 2: Top 10 County Cavan Electoral Divisions with an Increase in Population
Page 2 of 11
Electoral Division
Derrylahan
Teebone
Derrynananta
Percentage Increase
-20
-17.1
-12.5
Swanlinbar
Dunmakeever
Cavan Urban
Kinawley
Drumanespick
Templeport
-10.2
-8.6
-8.3
-8.3
-7.8
-7.1
Brucehall -5.9
Table 3: Top 10 County Cavan Electoral Divisions with a Decrease in Population
County Cavan population change 1946-2011
80000
70000
60000
50000
40000
30000
20000
10000
0
1946 1951 1956 1961 1966 1971 1979 1981 1986 1991 1996 2002 2006 2011
Diagram 1 County Cavan population change 1946-2011
Page 3 of 11
Housing Stock
There was a 13.3 per cent increase in the number of housing dwellings in the
State between 2006 and 2011, equivalent to an annual average increase of
46,912.
In 2006, County Cavan’s housing stock was 28,250. By 2011, Cavan’s housing stock had grown by 5,587 to 33,837 dwellings. Cavan had the second largest percentage increase in housing numbers (19.8%) in the intercensal period after Laois (21.2%). Counties Donegal, Leitrim and
Longford also showed increases of above 19 per cent. Limerick County and the five cities all showed the lowest percentage increases.
Housing Stock and Vacant Dwellings 2006 and 2011
State Housing stock 2006 (Number)
Vacant dwellings 2006 (Number)
Vacancy rate 2006 (%)
Housing stock 2011 (Number)
Vacant dwellings 2011 (Number)
Vacancy rate 2011 (%)
Actual change in vacant dwellings 2006-2011
(Number)
Percentage change in vacant dwellings 2006-
2011 (%)
Cavan Housing stock 2006 (Number)
Vacant dwellings 2006 (Number)
Vacancy rate 2006 (%)
Housing stock 2011 (Number)
Vacant dwellings 2011 (Number)
Vacancy rate 2011 (%)
Actual change in vacant dwellings 2006-2011
(Number)
Percentage change in vacant dwellings 2006-2011 (%)
Table 4 – Housing stock and vacant dwellings 2006 and 2011
Figures in the above table for 2011 are preliminary figures only.
1,769,613
266,322
15
2,004,175
294,202
14.7
27,880
10.5
28,250
5,997
21.2
33,837
7,479
22.1
1,482
24.7
Page 4 of 11
Vacant Dwellings
Almost 15 per cent of the State’s housing stock is currently vacant (294,000 houses), with the concentration of vacancies mainly in the west of the country.
In 2006 County Cavan had 5,997 vacant dwellings. By 2011, this had increased to 7,479, giving a vacancy rate of 22.1 per cent. The number of vacant dwellings in Cavan increased by 24.7 per cent between 2006 and
2011, according to the preliminary Census results.
Further data from Census 2011 will become available from end of March 2012
(see publication schedule in appendices).
This report is based on results of the preliminary count of the census which was held on 10
April, 2011. The results are based on summary counts for each enumeration area which have been compiled by 4,854 enumerators. Each enumerator wrote the total number of persons, males and females in each household onto the front of the census form and then prepared a clerical summary of the total for their area. These summaries were returned to the CSO in advance of the census forms themselves and the results in this report are based on this information. Results from the full Census 2011 volumes, to be published from March 2012, may differ slightly from these preliminary statistics.
Page 5 of 11
Appendices
Census 2011 - Publications Schedule
Publication type Date
Volume 29 March 2012 Principal Demographic
Results
Population Classified by
Area
Profile 1 – Geography
Profile 2 – Ages
Principal Socio-Economic
Results
Profile 3 – Workers and
Employment
Profile 4 – Housing
Profile 5 – Households,
Families and Marital Status
Profile 6 – Migration and
Diversity
Profile 7 – Disability, Carers and Health
Profile 8 – Education
Profile 9 – Commuting
Small Area Population
Statistics
Volume
Profile
Profile
Volume
Profile
Profile
Profile
Profile
Profile
Profile
Profile
Web Tables
26 April 2012
26 April 2012
24 May 2012
28 June 2012
26 July 2012
30 August 2012
20 September 2012
11 October 2012
1 November 2012
22 November 2012
13 December 2012
TBC
Page 6 of 11
Population and Actual and Percentage Change 2006 and 2011 by County Cavan Electoral Division, statistical indicator and Year
Population 2006 - Population 2011 - Actual change in population Percentage change in population persons (Number) persons (Number) 2006-2011 (Number) 2006-2011 (%)
001 Cavan Urban 3934 3607 -327 -8.3
002 Bailieborough
003 Carnagarve
3190
585
3846
623
656
38
20.6
6.5
004 Crossbane
005 Drumanespick
006 Enniskeen
007 Killinkere
008 Kingscourt
009 Lisagoan
489
421
391
368
2580
327
595
454
462
484
3229
385
106
33
71
116
649
58
21.7
7.8
18.2
31.5
25.2
17.7
010 Mullagh
011 Shercock
012 Skeagh
013 Taghart
014 Termon
015 Ballyconnell
016 Ballymagauran
1395
1029
394
560
472
1229
252
1947
1166
428
627
543
1508
253
552
137
34
67
71
279
1
39.6
13.3
8.6
12
15
22.7
0.4
017 Bawnboy
018 Benbrack
019 Bilberry
020 Carn
021 Diamond
022 Doogary
023 Kinawley
024 Lissanover
025 Pedara Vohers
026 Swanlinbar
027 Templeport
028 Tircahan
544
73
146
226
115
150
121
271
160
441
308
32
579
83
176
232
142
142
111
290
158
396
286
43
27
-8
-10
19
-2
35
10
30
6
-45
-22
11
6.4
13.7
20.5
2.7
23.5
-5.3
-8.3
7
-1.2
-10.2
-7.1
34.4
Page 7 of 11
Population and Actual and Percentage Change 2006 and 2011 by County Cavan Electoral Division, statistical indicator and Year
Population 2006 - Population 2011 - Actual change in population Percentage change in population persons (Number) persons (Number) 2006-2011 (Number) 2006-2011 (%)
029 Ballyjamesduff 2240 3067 827 36.9
030 Castlerahan
031 Kilbride
869
884
910
955
41
71
4.7
8
032 Lurgan
033 Munterconnaught
034 Virginia
035 Ardue
036 Arvagh
037 Ashfield
524
969
3197
633
900
346
564
1115
3939
731
925
339
40
146
742
98
25
-7
7.6
15.1
23.2
15.5
2.8
-2
038 Ballintemple
039 Ballyhaise
040 Ballymachugh
041 Bellananagh
042 Belturbet Urban
043 Bruce Hall
044 Butler's Bridge
459
982
713
1242
1395
219
371
459
952
762
1353
1360
206
477
0
-30
49
111
-35
-13
106
0
-3.1
6.9
8.9
-2.5
-5.9
28.6
045 Canningstown
046 Carrafin
047 Castlesaunderson
048 Cavan Rural
049 Clonervy
050 Cootehill Rural
051 Cootehill Urban
052 Corr
053 Corraneary
054 Crossdoney
055 Crosskeys
056 Cuttragh
558
363
223
4865
790
988
1436
255
406
542
643
342
571
418
280
7160
897
1056
1590
279
437
579
684
373
13
55
57
2295
107
68
154
24
31
37
41
31
2.3
15.2
25.6
47.2
13.5
6.9
10.7
9.4
7.6
6.8
6.4
9.1
Page 8 of 11
Population and Actual and Percentage Change 2006 and 2011 by County Cavan Electoral Division, statistical indicator and Year
Population 2006 - Population 2011 - Actual change in population Percentage change in population persons (Number) persons (Number) 2006-2011 (Number) 2006-2011 (%)
057 Denn 690 709 19 2.8
058 Derrin
059 Drumcarban
384
556
418
616
34
60
8.9
10.8
060 Drumcarn
061 Drung
062 Graddum
063 Grilly
064 Kilconny
065 Kill
522
546
475
402
379
352
545
535
537
403
480
370
23
-11
62
1
101
18
4.4
-2
13.1
0.2
26.6
5.1
066 Killashandra
067 Killykeen
068 Kilnaleck
069 Knappagh
070 Larah North
071 Larah South
072 Milltown
1130
538
956
421
444
477
338
1143
582
1057
440
501
464
339
13
44
101
19
57
-13
1
1.2
8.2
10.6
4.5
12.8
-2.7
0.3
073 Moynehall
074 Rakenny
075 Redhill
076 Springfield
077 Stradone
078 Tullyvin East
079 Tullyvin West
080 Waterloo
081 Derrylahan
082 Derrynananta
083 Dowra
084 Dunmakeever
1503
413
420
175
723
386
230
682
120
40
129
128
1681
445
438
196
778
424
264
757
96
35
161
117
178
32
18
21
55
38
34
75
-24
-5
32
-11
11.8
7.7
4.3
12
7.6
9.8
14.8
11
-20
-12.5
24.8
-8.6
Page 9 of 11
Population and Actual and Percentage Change 2006 and 2011 by County Cavan Electoral Division, statistical indicator and Year
Population 2006 - Population 2011 - Actual change in population Percentage change in population persons (Number) persons (Number) 2006-2011 (Number) 2006-2011 (%)
085 Eskey 283 341 58 20.5
086 Killinagh
087 Teebane
125
35
125
29
0
-6
0
-17.1
088 Tuam
089 Drumlumman
090 Kilcogy
091 Kilgolagh
092 Loughdawan
093 Scrabby
349
516
365
319
326
569
387
536
434
316
334
608
38
20
69
-3
8
39
10.9
3.9
18.9
-0.9
2.5
6.9
341,421 8.1 State 4,239,848 4,581,269
Table 5 Population change in County Cavan Electoral Divisions
Page 10 of 11
County
Cavan
Population Actual change
1821
1831
1841
1851
1861
1871
1881
1891
195,076
227,933
243,158
174,071
153,906
140,735
129,476
111,917
1901
1911
97,541
91,173
1926
1936
82,452
76,670
Table 6: Historical Data on County Cavan Population Size
32,857
15,225
-69,087
-20,165
-13,171
-11,259
-17,559
Intercensal percentage change
16.8
6.68
-28.41
-11.58
-8.56
-8.00
13.56
Page 11 of 11


