Spectrophotometric Determination of an Equilibrium Constant
advertisement
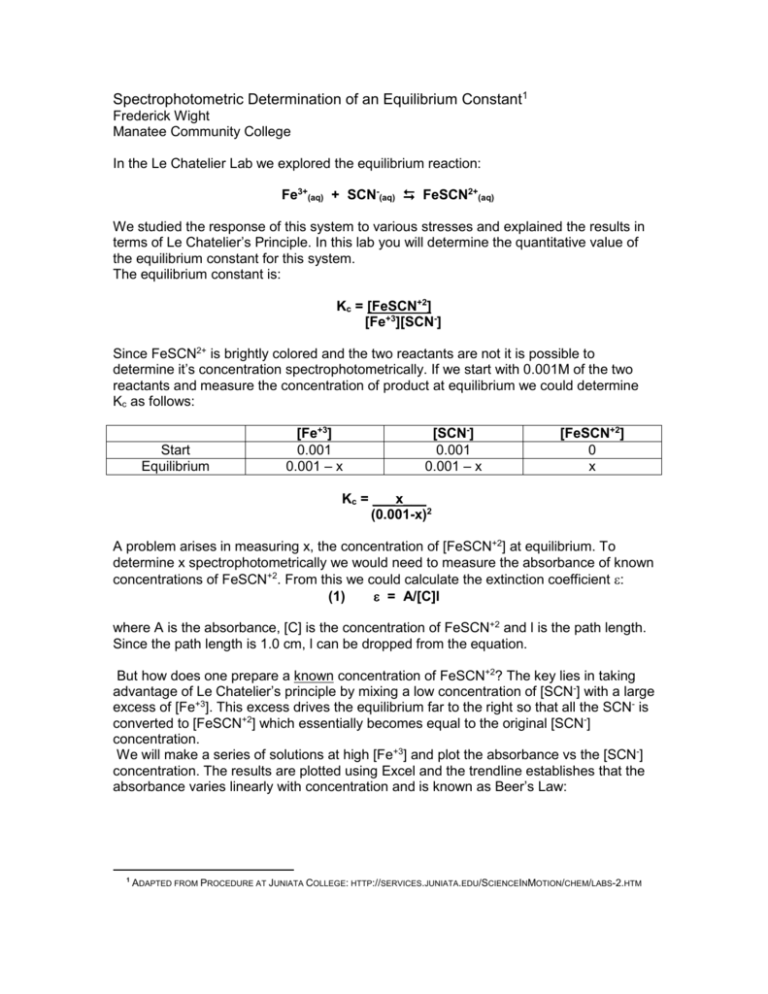
Spectrophotometric Determination of an Equilibrium Constant1 Frederick Wight Manatee Community College In the Le Chatelier Lab we explored the equilibrium reaction: Fe3+(aq) + SCN-(aq) FeSCN2+(aq) We studied the response of this system to various stresses and explained the results in terms of Le Chatelier’s Principle. In this lab you will determine the quantitative value of the equilibrium constant for this system. The equilibrium constant is: Kc = [FeSCN+2] [Fe+3][SCN-] Since FeSCN2+ is brightly colored and the two reactants are not it is possible to determine it’s concentration spectrophotometrically. If we start with 0.001M of the two reactants and measure the concentration of product at equilibrium we could determine Kc as follows: Start Equilibrium [Fe+3] 0.001 0.001 – x [SCN-] 0.001 0.001 – x [FeSCN+2] 0 x Kc = ___x___ (0.001-x)2 A problem arises in measuring x, the concentration of [FeSCN+2] at equilibrium. To determine x spectrophotometrically we would need to measure the absorbance of known concentrations of FeSCN+2. From this we could calculate the extinction coefficient : (1) = A/[C]l where A is the absorbance, [C] is the concentration of FeSCN+2 and l is the path length. Since the path length is 1.0 cm, l can be dropped from the equation. But how does one prepare a known concentration of FeSCN+2? The key lies in taking advantage of Le Chatelier’s principle by mixing a low concentration of [SCN-] with a large excess of [Fe+3]. This excess drives the equilibrium far to the right so that all the SCN- is converted to [FeSCN+2] which essentially becomes equal to the original [SCN-] concentration. We will make a series of solutions at high [Fe+3] and plot the absorbance vs the [SCN-] concentration. The results are plotted using Excel and the trendline establishes that the absorbance varies linearly with concentration and is known as Beer’s Law: 1 ADAPTED FROM PROCEDURE AT JUNIATA COLLEGE: HTTP://SERVICES.JUNIATA.EDU/SCIENCEINMOTION/CHEM/LABS-2.HTM (3) y = mx + b where: y = Absorbance m = (extinction coefficient) x = [FeSCN+2] b = constant Then a series of solutions at low concentrations of [SCN-] and [Fe+3] will be prepared and the absorbance of each solution measured from which x will be calculated: (4) x = (y-b)/m [FeSCN ] = (Absorbance – intercept)/ +2 Chemicals 0.002M KSCN/0.05M HNO3 0.002M Fe(NO3)3/0.05M HNO3 0.200M Fe(NO3)3/0.05M HNO3 0.05M HNO3 Test Tubes Materials Spec 20 Spectrophotometer 50 mL Erlenmeyer Flasks cuvets 5 mL and 25 mL graduated pipets Procedure – Generating a Beer’s Law Plot Prepare the following solutions in five 50 mL Erlenmeyer flasks. Use a separate pipet for each reagent. Do NOT pipet directly from the reagent bottle! Obtain a small portion of each solution sufficient for your needs in a beaker. Solution 1 2 3 4 5 0.00200M KSCN 2.5mL 2.0 mL 1.5 mL 1.0 mL 0.5 mL 0.200M Fe(NO3)3 5.0 mL 5.0 mL 5.0 mL 5.0 mL 5.0 mL 0.05M HNO3 17.5 mL 18.0 mL 18.5 mL 19.0 mL 19.5 mL Turn on the Spectronic 20 and set the wavelength to 450 nM. Use DI water to set the blank to zero absorbance. Measure the absorbance of each sample and enter the data in Data Table #1. Use Excel to plot a calibration curve of absorbance vs SCNconcentration. The slope of the trendline will be the extinction coefficient. Procedure-Determining Kc In 5 labeled test tubes add the following reagents with separate pipets for each reagent. Solution 1 2 3 4 5 0.00200M KSCN 1.0 mL 2.0 mL 3.0 mL 4.0 mL 5.0 mL 0.002M Fe(NO3)3 5.0 mL 5.0 mL 5.0 mL 5.0 mL 5.0 mL 0.05M HNO3 4.0 mL 3.0 mL 2.0 mL 1.0 mL 0 mL Measure the absorbance of each sample at 450 nm. Enter the data on the data Table #2. Finally, measure the absorbance of sample 5 every 20 nm from 340 to 600 nm. Be sure to set the blank to zero at every point!! Enter the data on the absorption spectrum data table #3 and plot the results in Excel. Fill in the remainder of data table #2 and calculate your average equilibrium constant. Data Table #1 Calibration data Trial [Fe+3] [SCN-] [FeSCN+2] Absorbance 1 2 3 4 5 Show your calculations for the concentration of Fe+3 and SCN- for trial 1: Trendline Equation (3): Slope = _____________________ (attach plot to lab report) Intercept =__________________ Data Table 2 - Calculation of Kc Trial: 1 2 3 Absorbance: Calculated [FeSCN+2] from A (Equation 4) Initial [Fe+3] Final [Fe+3] Initial [SCN-] Final [SCN-] Calculated Kc = [FeSCN+2] [Fe+3][SCN-] Average Kc: Show calculations of Kc for trial 1 4 5 Datatable 3 Absorption Spectrum of Kc Sample 5 Wavelength (nm) Absorbance 340 360 380 400 420 440 450 460 480 500 520 540 560 580 600 Plot the results in Excel and attaché to your lab report Postlab Questions 1. Why were absorption measurements made at 450 nm? 2. The equilibrium constant for the reaction: A + B C is 100. What is the concentration of C if you start with a solution of 0.01M each A and B? (Hint: use the quadratic formula. A quadratic equation solver can be found at: http://www.math.com/students/calculators/source/quadratic.htm 3. The cuvets for the Spectronic 20 look identical to ordinary laboratory test tubes. Suggest a reason why ordinary lab test tubes should not be used in the Spectronic 20?
