Mock Test Consumption of fast foods in Britain 1970 – 1990
advertisement
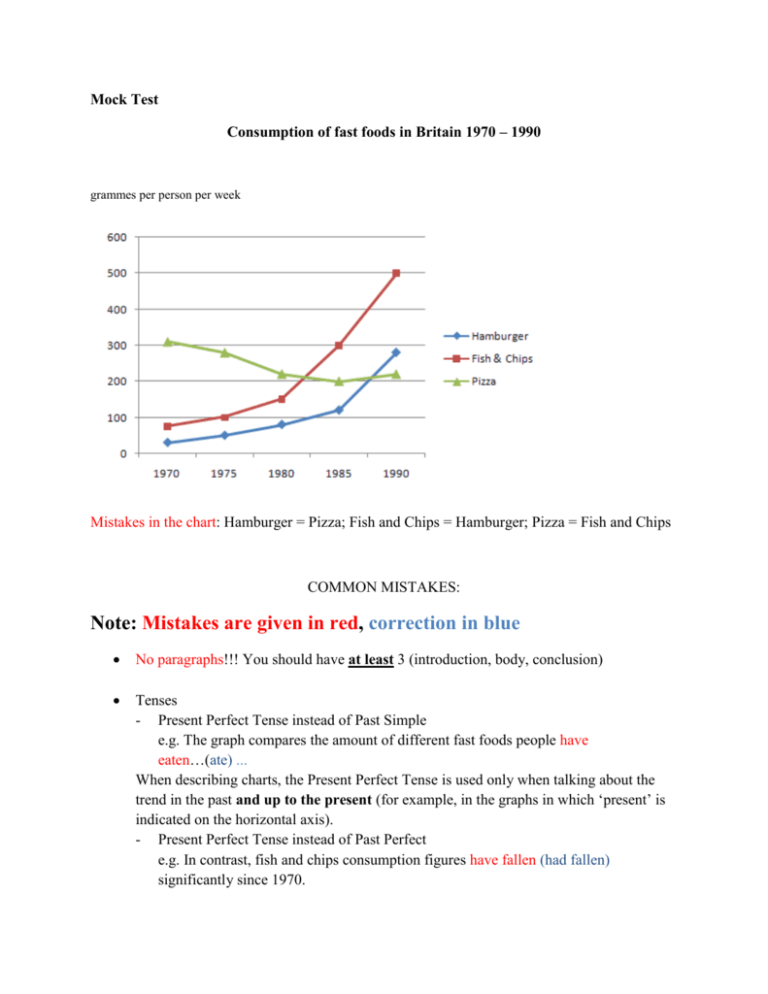
Mock Test Consumption of fast foods in Britain 1970 – 1990 grammes per person per week Mistakes in the chart: Hamburger = Pizza; Fish and Chips = Hamburger; Pizza = Fish and Chips COMMON MISTAKES: Note: Mistakes are given in red, correction in blue No paragraphs!!! You should have at least 3 (introduction, body, conclusion) Tenses - Present Perfect Tense instead of Past Simple e.g. The graph compares the amount of different fast foods people have eaten…(ate) ... When describing charts, the Present Perfect Tense is used only when talking about the trend in the past and up to the present (for example, in the graphs in which ‘present’ is indicated on the horizontal axis). - Present Perfect Tense instead of Past Perfect e.g. In contrast, fish and chips consumption figures have fallen (had fallen) significantly since 1970. - - - Present Simple Tense in the overview referring to the past e.g. Generally, more and more people eat (ate) hamburgers and pizza, whereas the consumption of fish and chips is (was) on the increase. (otherwise a good construction) Mixing Past Simple and Present Simple e.g. … the trend had (showed) a steep fall, whereas the consumption of both pizza and hamburgers gradually increases; increased Continuous Tenses are less common when describing charts (succession of actions) e.g. …the figures were decreasing… decreased Word order: - …which significantly changed; changed significantly; slightly dropped; dropped slightly; constantly rose; rose constantly; considerably increased; increased considerably!!!!! Prepositions: - During the period OF 1970 UNTIL 1990; BETWEEN 1970 AND 1990 - FROM the mid 1980s; better: SINCE - In the period OF next 10 years; OVER/(FOR) the next ten years - A gradual increase OF (IN) hamburger consumption continued up to 1985 - ...the consumption of this type of food amounted X 200g in 1985; amounted TO - ...the rate FOR consuming pizza; the rate OF pizza consumption - ..the consumption of fish and chips BY (IN) time became/had become... - ...trends OF (IN) pizza and hamburger consumption - ...remained ON (AT) a high level - ...reached a plateau WITH (OF) only 200g... - ...in the year OF (/) 1980 Articles: - Compares X consumption of different kinds of food; the consumption - ..., whereas X number of people who... the number - X considerably higher number of people; a considerably... - ...when there was X more dramatic surge; a more dramatic... - ..., reaching the high of 500 grammes per week; a high of... - According to X figures...; the figures... - ...on X weekly basis; on a weekly basis Grammar (pronouns, comparison, etc.): - Reaching it’s peak; its - ...there were less (fewer) people using (eating, consuming) fish and chips - the consumption of pizza and hamburgers was considerably lower than the one (that) of fish and chips - ...during this two decades; these two decades Word choice - Careful with ‘hit a trough’ – use only when the trend reaches the lowest (but usually a notably low) level; - The trend in ...had a slight rise; had a steep fall; (There was an upward/downward trend in...) - Overall, trends of pizza and hamburgers; the trend(s) in pizza and hamburger consumption - ...over 20 years’ time; over a twenty-year period - ...the figures for pizza and fish and chips overlapped in 1990 - ..the amount of pizza eaten accounted for 300 grammes (amounted to) (e.g. it accounts for one third of all students, accounts for 30 % of the total) Wrong sentence construction - There was shown a considerably higher number of persons eating fast food as (such as) hamburgers and pizza - ... of the fast food products mentioned above, taking except to (with the exception of) fish and chips which numbers (the consumption of which / whose figures) dropped steadily. Incorrect graph interpretation - When it comes to fish and chips, the number of 300 people consuming it per week started to drop in 1970 and the downward trend continued... (otherwise a good construction) Style – Do not use contracted forms! E.g. It’s obvious that… It is obvious that… EXAMPLES OF GOOD PRACTICE Expressions: in the given time span from that point on It is evident that / It can be clearly seen / It can be observed... As an overall trend, it can be seen that... Cohesive devices, reference words and phrases, conjunctions, participle constructions: ..., whereas the number of those consuming fish and chips remained stable after a slight fall between 1970 and 1980. ...after which it skyrocketed to a high of 500g in 1990. Pizza and hamburger consumption figures reached their peak in 1990, being (having been) 500 g and 290 g per person per week, respectively. As for pizza and hamburger consumption... / As far as ... is concerned / Introduction: The graph compares the consumption of three different types of fast food in Britain between 1970 and 1990. The graph shows changes in the amount of fast food consumed in Britain between 1970 and 1990. Overview: Overall, the consumption of fish and chips declined slightly, while hamburger and pizza consumption increased considerably. As an overall trend, it is clear that the consumption of pizza and hamburgers was on the increase, while fish and chips became less popular. Conclusion: It is clear that people in Britain started eating less fish and chips and more pizza and hamburgers over the 20-year-period.

