ele12448-sup-0001-SuppInfo
advertisement
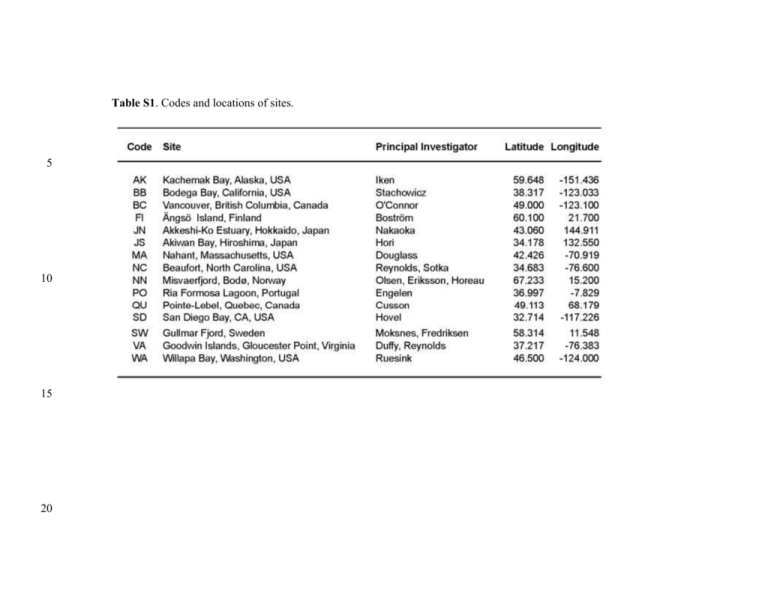
Table S1. Codes and locations of sites. 5 10 15 20 Table S2a. Parameter estimates () from the best-supported structural equation model (model 10, Figure 2b). Double-headed arrows indicate correlated errors, rather than directed paths, and are shown in the column for unstandardized estimate. 2 Table S2b. Parameter estimates for paths in models 9, 11, and 13 (Figure S3). Coefficients for other paths in these models are are identical to corresponding paths in model 10. 25 Table S3. Summary of results from prior experiments manipulating diversity or nutrient loading in eelgrass systems shown in Figure 3. 4 Table S3 (continued). 30 References Cited: 35 Baden, S., C. Boström, S. Tobiasson, H. Arponen, and P.-O. Moksnes. 2010. Relative importance of trophic interactions and nutrient enrichment in seagrass ecosystems: A broad-scale field experiment in the Baltic-Skagerrak area. LIMNOLOGY AND OCEANOGRAPHY 55:1435. Blake, R. E., and J. E. Duffy. 2010. Grazer diversity affects resistance to multiple stressors in an experimental seagrass ecosystem. Oikos 119:1625–1635. 40 45 Blake, R. E., and J. E. Duffy. 2012. Changes in biodiversity and environmental stressors influence community structure of an experimental eelgrass Zostera marina system. Marine Ecology Progress Series 470:41–54. Duffy, J. E., K. S. Macdonald, J. M. Rhode, and J. D. Parker. 2001. Grazer diversity, functional redundancy, and productivity in seagrass beds: an experimental test. Ecology 82:2417–2434. Duffy, J. E., J. P. Richardson, and E. A. Canuel. 2003. Grazer diversity effects on ecosystem functioning in seagrass beds. Ecology Letters 6:637–645. 50 55 Duffy, J. E., J. P. Richardson, and K. France. 2005. Ecosystem consequences of diversity depend on food chain length in estuarine vegetation. Ecology Letters 8:301–309. Eklöf, J. S., C. Alsterberg, J. N. Havenhand, K. Sundbäck, H. L. Wood, and L. Gamfeldt. 2012. Experimental climate change weakens the insurance effect of biodiversity. Ecology Letters 15:864–872. France, K. E., and J. E. Duffy. 2006a. Consumer diversity mediates invasion dynamics at multiple trophic levels. Oikos 113:515–529. 60 65 France, K. E., and J. E. Duffy. 2006b. Diversity and dispersal interactively affect predictability of ecosystem function. Nature 441:1139–1143. Hughes, A. R., and J. J. Stachowicz. 2004. Genetic diversity enhances the resistance of a seagrass ecosystem to disturbance. Proceedings of the National Academy of Sciences of the United States of America 101:8998–9002. Moksnes, P. O., M. Gullström, K. Tryman, and S. Baden. 2008. Trophic cascades in a temperate seagrass community. Oikos 117:763–777. 70 Reusch, T. B. H., A. Ehlers, A. Hämmerli, and B. Worm. 2005. Ecosystem recovery after climatic extremes enhanced by genotypic diversity. Proceedings of the National Academy of Sciences of the United States of America 102:2826–2831. 5 75 Reynolds, P. L., J. Paul Richardson, and J. Emmett Duffy. 2014. Field experimental evidence that grazers mediate transition between microalgal and seagrass dominance. LIMNOLOGY AND OCEANOGRAPHY 59:1053–1064. 6 Figure S1. Variation among sites in environmental and biological parameters. Histograms show the frequency of values across sites for each variable, with two-letter codes within histograms referring to sites listed in Table S1. Symbols at top of each panel show the median and interquartile range of values for Atlantic (blue) and Pacific (green) sites. Eelgrass %N, epiphytic algal (microalgal) biomass, and biomasses of crustacean and gastropod grazers are ambient values, i.e., means of samples from unmanipulated (control) plots at each site. Richness of eelgrass genotypes and grazer species represent site-level values and are summed across all plots at a site. 7 Figure S2. Effects of experimental grazer reduction (Deterrent), fertilization, and their interaction on biomass of grazers and epiphytic algae, and eelgrass leaf %N, at individual sites. Symbols show mean (+ 1 s.e.m.) effects on biomasses of (a-c) crustacean grazers, (d-f) gastropod grazers, and (g-i) epiphytic microalgae (as chl a), and of (j-l) eelgrass leaf % N as coefficients from the linear models. Site codes and symbols as in Fig. 1. * P < 0.05 in 2-factor ANOVA estimated for that site. 8 Figure S3 (part 1). Candidate structural equation models compared using AIC. See Materials and Methods for descriptions of models and Table 1 for model fits and AIC values. 80 9 Figure S3 (part 2). Candidate structural equation models compared using AIC. See Materials and Methods for descriptions of models and Table 1 for model fits and AIC values. 85 10 Figure S3 (part 3). Candidate structural equation models compared using AIC. See Materials and Methods for descriptions of models and Table 1 for model fits and AIC values. 11
