documentation
advertisement
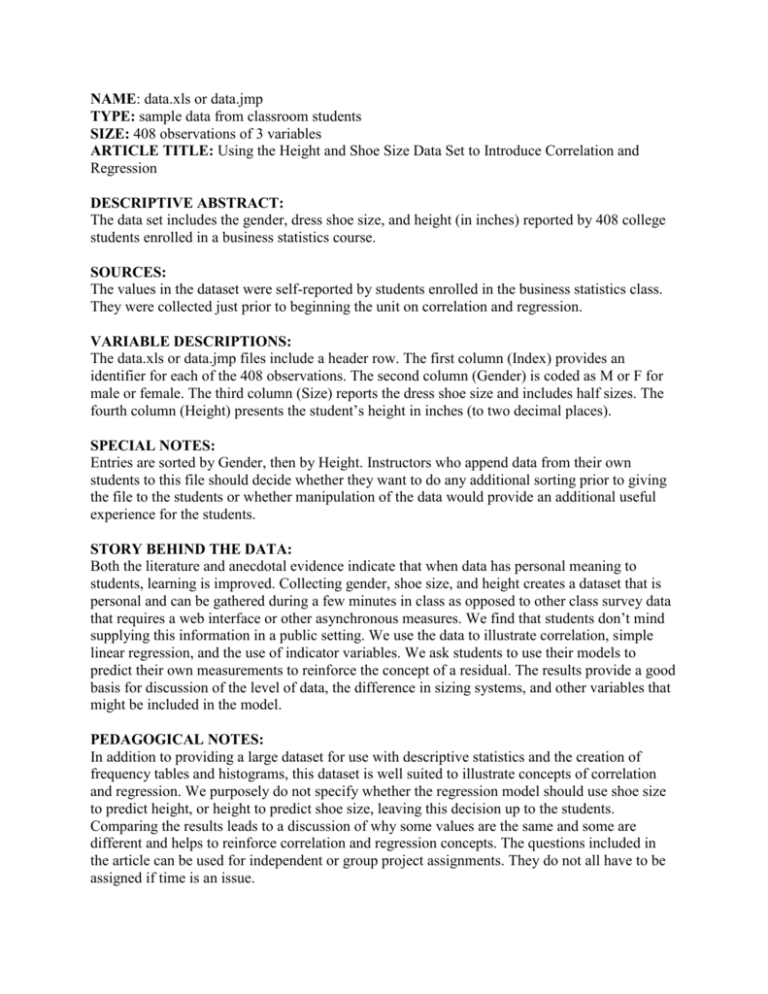
NAME: data.xls or data.jmp TYPE: sample data from classroom students SIZE: 408 observations of 3 variables ARTICLE TITLE: Using the Height and Shoe Size Data Set to Introduce Correlation and Regression DESCRIPTIVE ABSTRACT: The data set includes the gender, dress shoe size, and height (in inches) reported by 408 college students enrolled in a business statistics course. SOURCES: The values in the dataset were self-reported by students enrolled in the business statistics class. They were collected just prior to beginning the unit on correlation and regression. VARIABLE DESCRIPTIONS: The data.xls or data.jmp files include a header row. The first column (Index) provides an identifier for each of the 408 observations. The second column (Gender) is coded as M or F for male or female. The third column (Size) reports the dress shoe size and includes half sizes. The fourth column (Height) presents the student’s height in inches (to two decimal places). SPECIAL NOTES: Entries are sorted by Gender, then by Height. Instructors who append data from their own students to this file should decide whether they want to do any additional sorting prior to giving the file to the students or whether manipulation of the data would provide an additional useful experience for the students. STORY BEHIND THE DATA: Both the literature and anecdotal evidence indicate that when data has personal meaning to students, learning is improved. Collecting gender, shoe size, and height creates a dataset that is personal and can be gathered during a few minutes in class as opposed to other class survey data that requires a web interface or other asynchronous measures. We find that students don’t mind supplying this information in a public setting. We use the data to illustrate correlation, simple linear regression, and the use of indicator variables. We ask students to use their models to predict their own measurements to reinforce the concept of a residual. The results provide a good basis for discussion of the level of data, the difference in sizing systems, and other variables that might be included in the model. PEDAGOGICAL NOTES: In addition to providing a large dataset for use with descriptive statistics and the creation of frequency tables and histograms, this dataset is well suited to illustrate concepts of correlation and regression. We purposely do not specify whether the regression model should use shoe size to predict height, or height to predict shoe size, leaving this decision up to the students. Comparing the results leads to a discussion of why some values are the same and some are different and helps to reinforce correlation and regression concepts. The questions included in the article can be used for independent or group project assignments. They do not all have to be assigned if time is an issue. REFERENCES: There are no additional references for the dataset values. SUBMITTED BY: Constance H. McLaren Scott College of Business at Indiana State University Marketing and Operations Department cmclaren@indstate.edu

