Genome assembly and genome features of C. sinensis Figure S1
advertisement
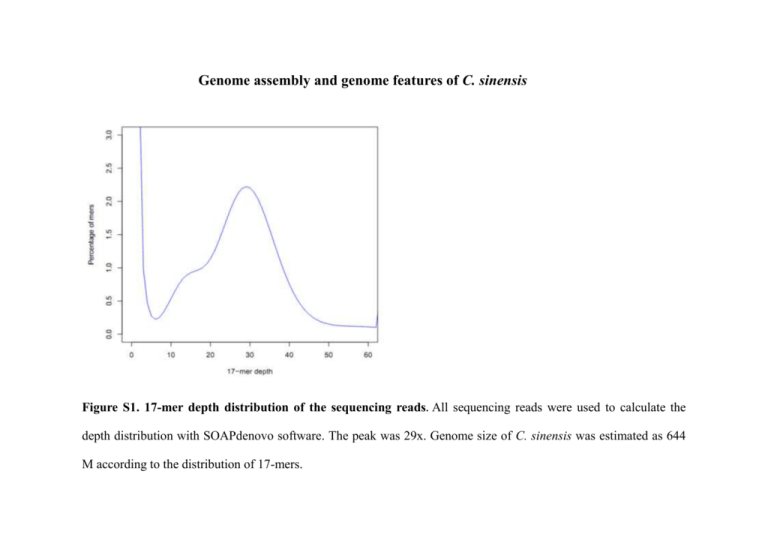
Genome assembly and genome features of C. sinensis Figure S1. 17-mer depth distribution of the sequencing reads. All sequencing reads were used to calculate the depth distribution with SOAPdenovo software. The peak was 29x. Genome size of C. sinensis was estimated as 644 M according to the distribution of 17-mers. Figure S2. The features of assembled C. sinensis genome. (a) Local GC content versus sequencing depth. 500 bp non-overlapping sliding windows along with the assembled sequence were used to calculate GC content and average sequencing depth. (b) GC content of sequencing reads and assembled genome. The average GC content of sequencing reads (red) and assembled genome (black) was 44.38% and 43.85%, respectively. (c) GC content distribution of Clonorchis sinensis, Schistosoma japonicum, Schistosoma mansoni, Caenorhabditis elegans, and Homo sapiens. (d) Distribution of sequencing depth of the assembled genome. The peak was 30x. 98% of genome was covered by more than 10 reads. Figure S3. Distribution of heterozygosity in C. sinensis. We used non-overlapping 10 kb windows and then calculated heterozygosity in each window. The heterozygosity was approximately 0.4% for the whole genome. Figure S4. Protein domain analysis of C. sinensis, S. mansoni, and S. japonicum. A total 5,027 protein domain types were detected in C. sinensis, S. mansoni and S. japonicum. 3,204 domain types were shared by all three flukes. Table S1. Main features of C. sinensis genome sequencing data Insert size of libraries (bp) # of GA lanes Avg. reads length (bp) Sum of reads length (GB) Sequence coverage (X)* Physical coverage (X)* 350 2 115 54,902,516 12.63 19.6 29.8 500 2 115 39,400,565 9.06 14.1 30.6 All 4 115 94,303,081 25.69 33.7 60.4 # of reads *We calculated sequence and physical coverage based on the estimated genome size of 644 M. Table S2. Numbers of reads mapped to the assembled C. sinensis genome # of mismatch # of reads % of reads 0 112,729,998 59.78 1 24,531,382 13.00 2 7,861,556 4.17 3 3,815,863 2.02 total 148,938,799 78.98 ≤3 9,304,459 4.93 Un-mapped 30,344,904 16.09 Total 188,588,162 100 Unique-mapped Multi-mapped Table S3. Genome validation by PCR products PCR products id E02_340191.1.G1101244144.1.1-F(A3067) E03_340191.2.G1101244145.1.1-R(A3068) E04_340191.3.G1101244146.2.2-F(A3069) E05_340191.4.G1101244147.2.2-R(A3070) E06_340191.5.G1101244148.3.3-F(A3071) E07_340191.6.G1101244149.3.3-R(A3072) E08_340191.7.G1101244150.4.4-F(A3073) E09_340191.8.G1101244151.4.4-R(A3074) E12_340191.11.G1101244154.6.6-F(A3077) F01_340191.12.G1101244155.6.6-R(A3078) F02_340191.13.G1101244156.7.7-F(A3079) F03_340191.14.G1101244157.7.7-R(A3080) F04_340191.15.G1101244158.8.8-F(A3081) F05_340191.16.G1101244159.8.8-R(A3082) F06_340191.17.G1101244160.9.9-F(A3083) F07_340191.18.G1101244161.9.9-R(A3084) H05_329431.1.G1101144271.14-3-3.14-3-3F(A2666) H06_329431.2.G1101144272.14-3-3.14-3-3R(A2667) H07_329431.3.G1101144273.CYS.CYSF(A2668) H08_329431.4.G1101144274.CYS.CYSR(A2669) HB1-GAPDH.seq CSHN1-ACTIN.seq CSHN1-EF-1A.seq CSHN1_tubulin.seq Primer CAGCCAGAATACCCGAAGA TCGTAATTGGTTCCGCTCT CTGGGATGCTCCTTTATTCG TTCCACAATGCCTTTCAAG GGCAGTTGCTCGTAGACA TACTTGGCGGGAACTCTT ACGCTCCATCCATCGGAAAC TAGCCCAACCGGATCACTTA TTCCTCCGGTTGTGTACATTTCC CCAACTTAGCCGGAAACGAA TACAGTTCGGCGATTCCACC GACGGGTTGCTGGCACTA GACGGGCAGTAGATGAGG GTTGCTTACCGAACCAGA CCATCAGAGCTGCCTTGTC TCTTGGATGTCGGCGGTA GTCGGATCCATGACTGAACGTGAGACTC ATACTCGAGCTACGCCTTCTCCTCCG ATAGGATCCATGACGTCAACACGTCTG CGCCTCGAGTCAAAAATAATCCAACGG ACTGGGATCCGAGATGTCCAAACCTAAG GCCCCTCGAGCCATTCTTCTTGAATTTA ATGGGTGATGAGGACGTTGCAGCT CATGATCGAGTTGTACGTCGTCTC ACAGCACCACTCCTCCGTAT CCTCAGTCTTCTTGGCAACC GCTTACTCATTCCCTTGGTG ATCTCGTCCATACCTTCTCC Length (bp) 575 568 668 617 372 327 296 614 325 398 587 275 748 809 898 899 807 873 494 491 Start 56640 57149 7983 10712 7080 7383 18662 20224 32003 34790 72792 74567 25286 27238 29208 30241 11412 10572 7409 6996 End 57214 56582 8650 10096 7451 7057 18957 19612 32327 34393 73378 74293 26033 26430 30105 29343 10607 11443 6916 7486 Identity 572/575 565/568 667/668 617/617 367/372 324/327 295/296 611/614 325/325 398/398 586/587 275/275 747/748 809/809 898/898 899/899 805/807 871/873 490/494 483/491 % of mismatch* 0.52 0.53 0.15 0.00 1.34 0.92 0.34 0.49 0.00 0.00 0.17 0.00 0.13 0.00 0.00 0.00 0.25 0.23 0.81 1.63 870 scf00518 299295 300014 868/870 0.23 777 scf24125 23701 24477 771/777 0.77 789 scf23034 923 1711 787/789 0.25 782 scf02450 36135 35354 782/782 0.00 *The proportion of mismatch sites between the genome and PCR products is 0.37% on average. Subject scf01432 scf01432 scf09369 scf09369 scf23554 scf23554 scf18672 scf18672 scf12717 scf12717 scf10467 scf10467 scf00153 scf00153 scf24606 scf24606 scf08144 scf08144 scf23554 scf23554 Table S4. Genome validation by Sanger ESTs Mapped # (%) Total # § All Filtered* ESTs from NCBI 2970 2741(92.3) 2659 (89.3) Metacercaria ESTs§ 9455 8230(87.4) 8109 (85.7) Adult ESTs§ 2696 2605(96.6) 2574 (95.5) Total 15121 13576(89.8) 13342(88.2) We sequenced metacercaria ESTs and adult ESTs and constructed metacercaria cDNA library and adult cDNA library in our laboratory. *Sanger ESTs were anchored onto the genomic assemblies as spliced alignments using BLAT. In total, 13,342 out of 15,121 transcript sequences (88.2) could be mapped to the genomic sequence with a minimum alignment length of 100 nucleotides. Table S5. Repeat composition of C. sinensis genome RepeatMasker RepeatModeler Percentage Percentage Number Number of Length of of of elements occupied sequence sequence elements (#) (bp) (%) (%) (#) Number of elements (#) Length occupied (bp) SINEs 2074 190699 0.04 0 0 0 LINEs 1163 107552 0.02 151054 53385077 52 2884 0 13850 55 3606 0 1 52 22360 LTR elements DNA elements Unclassified Simple repeats Low complexity Total Total Length occupied (bp) Percentage of sequence (%) 2074 190699 0.04 10.34 152217 53492629 10.36 5341271 1.03 13902 5344155 1.03 5407 1859650 0.36 5462 1863256 0.36 0 373310 71661667 13.88 373311 71661719 13.88 1300419 0.25 1 24 0 22361 1300443 0.25 6227 206195 0.04 0 0 0 22361 206195 0.04 31932 1811407 0.35 543622 132247689 25.61 575554 134059096 25.96 Table S6. Summary of predicted protein-coding genes by different methods # Number Average length of gene length (bp) Average length of CDS (bp) # Exons per gene Average length of exon (bp) Average length of intron (bp) S. jap 6,562 1,748 462 1.57 293 1,456 S. man 8,603 2,319 492 1.7 288 1,767 Genscan 53,060 6,435 876 4.57 192 1,617 Augustus 10,085 7,293 999 3.58 279 2,299 EVM 31,526 7,458 879 4.43 198 1,861 Gene set Protein homology search Gene finder Table S7. Statistics of reliable gene set with homology, or functional annotation or putative full-length ORFs support Database # Number Proportion (%) Swiss-Prot 8,888 54.6 KEGG 13,495 83.0 InterPro 6,847 42.8 GO 9,418 57.8 NR 13,648 83.9 Total 14,981 92.0 Un-annotated, but with S. jap or S. man homology 744 4.6 Un-annotated, non-homology, but supported by putative full-length ORFs * 533 3.3 16,258 100 Annotated Reliable gene set * Putative full-length ORFs were assembled by Newbler using 454 sequences and ORF were obtained by Orphelia [95]. The criterion of support by putative full-length ORFs is at least 50 amino acids alignment with > 90% identity. Table S8. Homolog gene numbers between CEGMA set of 458 core eukaryotic genes and our gene models Alignment percent >0% >50% >80% >90% >95% Total Number of genes 425 392 301 235 179 458 Percent of genes 92.8% 85.6% 65.7% 51.3% 39.1% 100% Table S9. Summary of gene families in several organisms Organism Gene No. MCL cluster No.* Gene No./Clust No. C. sinensis 16258 6910 2.35 S. japonicum 13469 8898 1.51 S. mansoni 11789 7313 1.61 C. elegans 20362 10180 2.00 D. melanogaster 13775 7640 1.80 A. gambiae 11971 6813 1.76 D. rerio 24004 7865 3.05 G. gallus 16704 8496 1.97 H. sapiens 21837 8841 2.47 * Gene families were estimated by gene clusters resulted from MCL algorithm according to sequence similarities of peptides (described in Methods Section). Table S10. Summary of genes annotated by InterPro domains in several species Species Gene No. Gene No. with protein domain Domain types* C. sinensis 16,258 6,847 3,675 S. japonicum 13,469 8,597 4,578 S. mansoni 11,789 6,898 4,422 C. elegans 20,224 13,470 4,129 D. melanogaster 13,804 10,737 5,012 D. rerio 24,020 21,207 5,787 G. gallus 16,736 12,854 5,361 H. sapiens 21,598 18,167 6,677 * Number of unique InterPro IDs annotating the genes of the species. Table S11. Summary of predicted non-coding RNA genes in the C. sinensis genome ncRNA Type Copy # Average Length (bp) Total length% (bp) % of genome rRNA 7 338 2366 4.6e-4 tRNA 235 77 18,098 0.0035 snoRNA 509 77 39,008 0.0075 snRNA 169 80 13,603 0.0026 miRNA 858 64 55,333 0.01


