STAT3503 Lab 4 Due Nov
advertisement
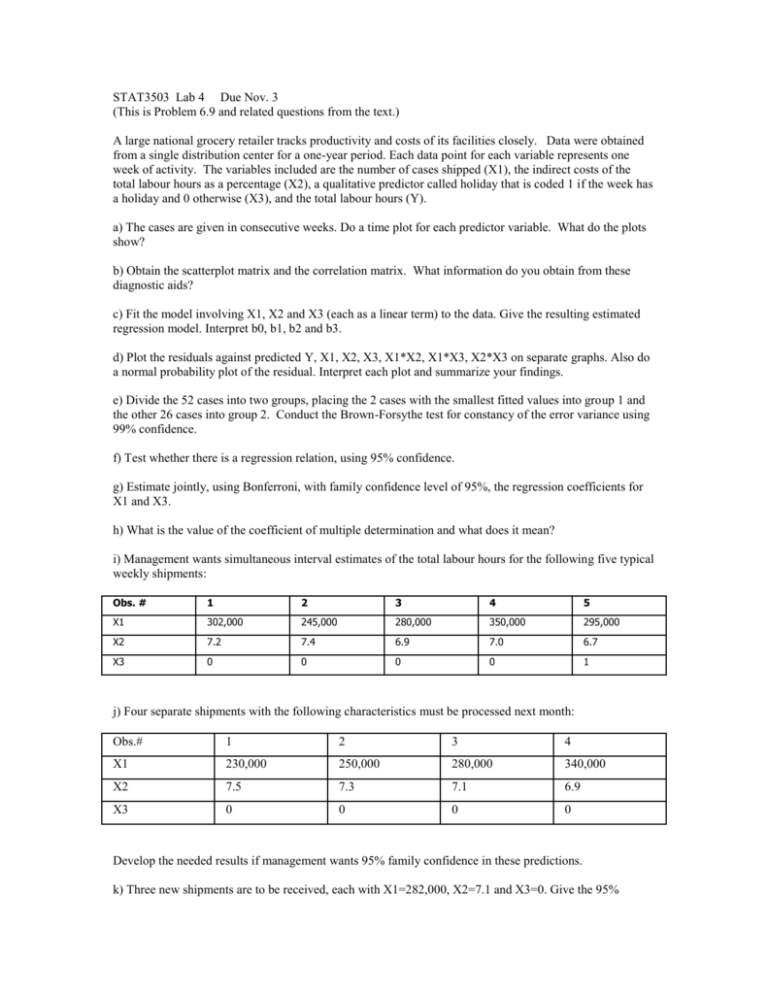
STAT3503 Lab 4 Due Nov. 3 (This is Problem 6.9 and related questions from the text.) A large national grocery retailer tracks productivity and costs of its facilities closely. Data were obtained from a single distribution center for a one-year period. Each data point for each variable represents one week of activity. The variables included are the number of cases shipped (X1), the indirect costs of the total labour hours as a percentage (X2), a qualitative predictor called holiday that is coded 1 if the week has a holiday and 0 otherwise (X3), and the total labour hours (Y). a) The cases are given in consecutive weeks. Do a time plot for each predictor variable. What do the plots show? b) Obtain the scatterplot matrix and the correlation matrix. What information do you obtain from these diagnostic aids? c) Fit the model involving X1, X2 and X3 (each as a linear term) to the data. Give the resulting estimated regression model. Interpret b0, b1, b2 and b3. d) Plot the residuals against predicted Y, X1, X2, X3, X1*X2, X1*X3, X2*X3 on separate graphs. Also do a normal probability plot of the residual. Interpret each plot and summarize your findings. e) Divide the 52 cases into two groups, placing the 2 cases with the smallest fitted values into group 1 and the other 26 cases into group 2. Conduct the Brown-Forsythe test for constancy of the error variance using 99% confidence. f) Test whether there is a regression relation, using 95% confidence. g) Estimate jointly, using Bonferroni, with family confidence level of 95%, the regression coefficients for X1 and X3. h) What is the value of the coefficient of multiple determination and what does it mean? i) Management wants simultaneous interval estimates of the total labour hours for the following five typical weekly shipments: Obs. # 1 2 3 4 5 X1 302,000 245,000 280,000 350,000 295,000 X2 7.2 7.4 6.9 7.0 6.7 X3 0 0 0 0 1 j) Four separate shipments with the following characteristics must be processed next month: Obs.# 1 2 3 4 X1 230,000 250,000 280,000 340,000 X2 7.5 7.3 7.1 6.9 X3 0 0 0 0 Develop the needed results if management wants 95% family confidence in these predictions. k) Three new shipments are to be received, each with X1=282,000, X2=7.1 and X3=0. Give the 95% prediction interval for the average handling time for these new shipments. Then convert the interval obtained into a 95% prediction interval for the total labour hours for he these shipments. l) For the following situations, determine if you should use your model: X1 400,000 400,000 X2 7.2 9.9 X3 0 0


![Academic Support Secretary [Final]](http://s3.studylib.net/store/data/007664694_2-fb8ecec276d74e1f06c519da8d1b2e5c-300x300.png)

