Salinity Changes in the Chesapeake Bay
advertisement

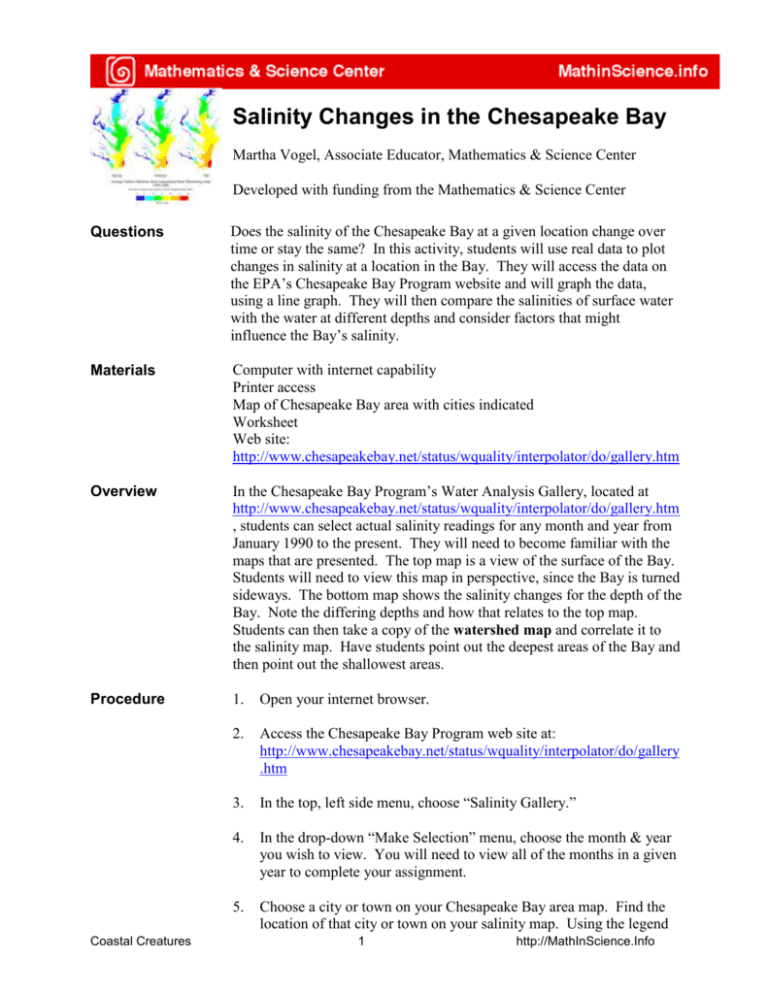
Salinity Changes in the Chesapeake Bay Martha Vogel, Associate Educator, Mathematics & Science Center Developed with funding from the Mathematics & Science Center Questions Does the salinity of the Chesapeake Bay at a given location change over time or stay the same? In this activity, students will use real data to plot changes in salinity at a location in the Bay. They will access the data on the EPA’s Chesapeake Bay Program website and will graph the data, using a line graph. They will then compare the salinities of surface water with the water at different depths and consider factors that might influence the Bay’s salinity. Materials Computer with internet capability Printer access Map of Chesapeake Bay area with cities indicated Worksheet Web site: http://www.chesapeakebay.net/status/wquality/interpolator/do/gallery.htm Overview In the Chesapeake Bay Program’s Water Analysis Gallery, located at http://www.chesapeakebay.net/status/wquality/interpolator/do/gallery.htm , students can select actual salinity readings for any month and year from January 1990 to the present. They will need to become familiar with the maps that are presented. The top map is a view of the surface of the Bay. Students will need to view this map in perspective, since the Bay is turned sideways. The bottom map shows the salinity changes for the depth of the Bay. Note the differing depths and how that relates to the top map. Students can then take a copy of the watershed map and correlate it to the salinity map. Have students point out the deepest areas of the Bay and then point out the shallowest areas. Procedure 1. Open your internet browser. 2. Access the Chesapeake Bay Program web site at: http://www.chesapeakebay.net/status/wquality/interpolator/do/gallery .htm 3. In the top, left side menu, choose “Salinity Gallery.” 4. In the drop-down “Make Selection” menu, choose the month & year you wish to view. You will need to view all of the months in a given year to complete your assignment. 5. Choose a city or town on your Chesapeake Bay area map. Find the location of that city or town on your salinity map. Using the legend Coastal Creatures 1 http://MathInScience.Info on the salinity map, record the approximate salinity of the water at your city or town for that month in the place provided on your worksheet. 6. Continue recording salinities of the waters near your city or town for the entire year that you’ve chosen. 7. Use the salinity data you have recorded to make a line graph of your results on your worksheet. 8. Look at the salinity data for September 2003, before Hurricane Isabelle hit. In the bottom left menu, choose “Salinity Gallery” and look at the salinity data for October 2003, after the hurricane. 9. Save each image to a Word document. 10. Print out your document in color, if possible, and attach to your worksheet. 11. Answer the questions at the bottom of your worksheet. Teaching Tips Reserve the computer lab for this activity and make sure the students have access to a printer (color, if possible). Closure Discuss the questions on the worksheet. Have the students offer explanations for the differences in salinities in some of the maps. Compare the same month in the different years selected by the students and discuss. Discuss hurricanes and their effect on the Chesapeake Bay. Coastal Creatures 2 http://MathInScience.Info Salinity Changes in the Chesapeake Bay Practice Activity Worksheet 1. What city did you choose? __________________________ 2. In which state is your city located? _____________________ 3. For what year did you choose to record data? _____________ 4. List the surface salinities for that year of the water near your chosen city: January _____________ February ____________ March ______________ April _______________ May _______________ June _______________ July _______________ August _____________ September __________ October ____________ November __________ December _________ 5. Graph your findings: Use the outline below to construct a line graph of your data. Put a title on your graph and label your units of measure. Coastal Creatures 3 http://MathInScience.Info 6. Month with the highest salinity ______________ Salinity __________ 7. Month with the lowest salinity _______________ Salinity __________ 8. Why do you think that these changes took place? 9. How does the salinity at the bottom of the Bay near your city differ from the surface salinity? 10. Is the difference in surface and bottom salinity the same for each month of the year, or does it change from season to season? Why? 11. Look at the salinities of the Bay in late August 2003. Using the bottom window of the website, select Salinity Gallery. Find the salinity map for November 2003. What general trends do you notice, if any? 12. Now look at August 2002 and November 2002. Do you see the same trends? 13. Since Hurricane Isabel hit Virginia in September 2003, would you expect there to be changes in the salinity of the water after the hurricane? 14. Are the changes what you would have expected? 15. How would you explain the changes in salinity in the Bay from before the hurricane to two months after the storm? You can use the maps from September and October 2003 as well to help you answer the question. Also, think about what happens during a hurricane (wind, rain, storm surge). Coastal Creatures 4 http://MathinScience.info Salinity Changes in the Chesapeake Bay Key to Practice Activity Worksheet The city chosen and the year will affect the answers the students give. In some cases, the data for a particular month will not be available. Students will either need to skip the recording for that month and graph an approximation based on the months before and after the missing data, or choose another year. 8. The months with the highest and lowest salinities will change depending on the amount of rainfall that month. For advanced students, have them look up rainfall data for Virginia and see how it corresponds to the salinity data, taking into consideration that a lot of fresh water comes out of the mountains. 9. In most cases, the surface salinity of the water should be lower than the salinity of the water at the bottom due to the difference in densities. 10. The difference from the surface to the bottom salinities is not constant. It varies depending on winds, rainfall, storm surge, and temperature inversions. It is more important for students to see that there are differences from month to month than it is to try to explain why these differences occurred. 11. The main difference to notice is that the salinity of the water is higher in the upper areas of the Bay in November than it is in late August. There was a lot of rain in August 2003, which would have lowered the salinity of the water somewhat. 12. The differences in 2002 are less pronounced, but the salinities in the upper Bay and those in the water close to the ocean are definitely higher in August than they are in November. This was about the time when the drought was at its peak in our area. 13. Yes, there should be changes in the water salinity before and after a hurricane. 14. It could be expected that since hurricanes bring a lot of rain, then the salinity of the Bay should go down due to the influx of fresh water. However, this is not the case in 2003. 15. The most likely explanation is that the large storm surge and the winds sent a huge amount of water from the ocean up into the Bay, increasing the overall salinity of the water. Students could use this opportunity to read up on the effects of hurricanes in an area. Coastal Creatures 5 http://MathinScience.info


