Keuning et al
advertisement
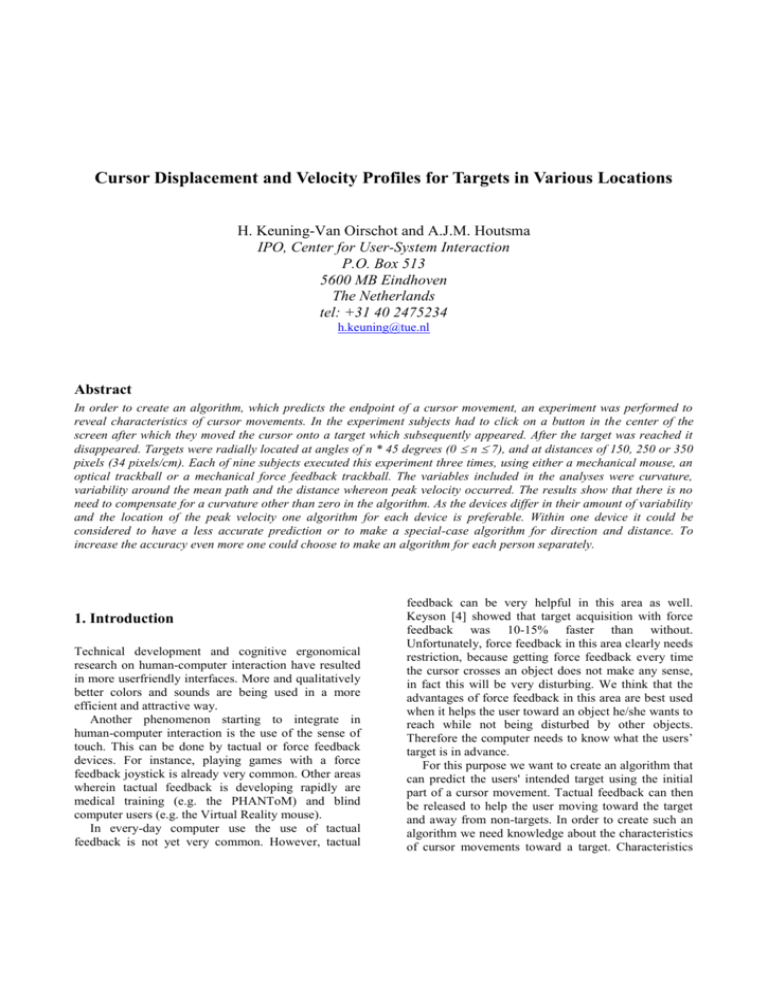
Cursor Displacement and Velocity Profiles for Targets in Various Locations H. Keuning-Van Oirschot and A.J.M. Houtsma IPO, Center for User-System Interaction P.O. Box 513 5600 MB Eindhoven The Netherlands tel: +31 40 2475234 h.keuning@tue.nl Abstract In order to create an algorithm, which predicts the endpoint of a cursor movement, an experiment was performed to reveal characteristics of cursor movements. In the experiment subjects had to click on a button in the center of the screen after which they moved the cursor onto a target which subsequently appeared. After the target was reached it disappeared. Targets were radially located at angles of n * 45 degrees (0 n 7), and at distances of 150, 250 or 350 pixels (34 pixels/cm). Each of nine subjects executed this experiment three times, using either a mechanical mouse, an optical trackball or a mechanical force feedback trackball. The variables included in the analyses were curvature, variability around the mean path and the distance whereon peak velocity occurred. The results show that there is no need to compensate for a curvature other than zero in the algorithm. As the devices differ in their amount of variability and the location of the peak velocity one algorithm for each device is preferable. Within one device it could be considered to have a less accurate prediction or to make a special-case algorithm for direction and distance. To increase the accuracy even more one could choose to make an algorithm for each person separately. 1. Introduction Technical development and cognitive ergonomical research on human-computer interaction have resulted in more userfriendly interfaces. More and qualitatively better colors and sounds are being used in a more efficient and attractive way. Another phenomenon starting to integrate in human-computer interaction is the use of the sense of touch. This can be done by tactual or force feedback devices. For instance, playing games with a force feedback joystick is already very common. Other areas wherein tactual feedback is developing rapidly are medical training (e.g. the PHANToM) and blind computer users (e.g. the Virtual Reality mouse). In every-day computer use the use of tactual feedback is not yet very common. However, tactual feedback can be very helpful in this area as well. Keyson [4] showed that target acquisition with force feedback was 10-15% faster than without. Unfortunately, force feedback in this area clearly needs restriction, because getting force feedback every time the cursor crosses an object does not make any sense, in fact this will be very disturbing. We think that the advantages of force feedback in this area are best used when it helps the user toward an object he/she wants to reach while not being disturbed by other objects. Therefore the computer needs to know what the users’ target is in advance. For this purpose we want to create an algorithm that can predict the users' intended target using the initial part of a cursor movement. Tactual feedback can then be released to help the user moving toward the target and away from non-targets. In order to create such an algorithm we need knowledge about the characteristics of cursor movements toward a target. Characteristics can be the curvature of paths, the variability of paths around the mean path and the velocity profiles. When we know these path's statistics it is possible to use the initially observed direction and velocity of a cursor movement to predict the location of the users' intended target. The amount of variability can be used to estimate the maximum target resolution at which an algorithm can predict the user's target with a certain pre-specified probability. However, these characteristics could be influenced by factors like direction, distance, device and user. In this paper we describe an experiment in which we explore cursor movements from a fixed starting point to targets located at three different distances and in eight different directions. When the factors mentioned do not influence the characteristics it is possible to create a general prediction-algorithm which is valid for all cases. When the factors do influence the characteristics, it might be useful to create special-case algorithms or to give in to the accuracy of the prediction. 2. The experiment This experiment aimed to analyse cursor trajectories created by computer users in eight different directions, three different distances and three different devices. The data sampled were the co-ordinates and time. From these data we calculated mean paths curvatures, the variability around the mean paths and velocity profiles. In the analyses the following aspects were involved: Per device we tested whether the mean path curvatures in each direction and on each distance differed from zero. A non-zero curvature would mean that the trajectories are not straight, but curved in a certain way. When this is the case it could be useful to compensate for it in the general prediction-algorithm. Also, when this is the case for some of the mean paths, for example in one direction, it could be useful to alter the general algorithm for this occasion. We investigated the influence of the different factors on the variability around the mean path. The amount of variability defines the accuracy with which the prediction can be made. More variability means a less accurate prediction. For example when 90% of the paths vary within 20 pixels around the mean path, an accuracy of 90% can be reached when objects are located 40 pixels away from each other. That is two times the variation around each mean path. By decreasing the resolution of the objects the accuracy of the prediction will increase. We calculated at what fraction of the target distance velocity was maximum. In the general algorithm this fraction sets the multiplication factor to assess the target distance. As well as the other variables, this fraction could be influenced by direction, distance, devices or user and therefore needs special-case multiplication factors. 2.1. Material and techniques The experiment was done with three devices; a mechanical mouse, an optical trackball and a mechanical force feedback trackball. The mechanical mouse we used was a Logitec mouse. We call this a mechanical mouse because the movement of the cursor is related to the mechanical movement of the ball within the mouse. The optical trackball was the Logitec Marble Mouse. The force feedback trackball is a trackball with two motors, which can roll the ball in either x- or y-direction [2]. Without activating the motors this trackball acts as a normal trackball except that it is rather big (diameter 55mm) and that the friction is greater as a result of the contact wheels of the motors. Figure 1. The mechanical force feedback trackball (opened) We used a PC (Pentium II) and a 17-inch Dell-monitor with 1248*768 pixels for the sessions with the mechanical mouse and the optical trackball. For the session with the force feedback trackball we used a 386-PC and a 17-inch Philips Monitor. On the screen an interface was created with Visual Basic 5.0. The target consisted of a black circle 30 pixels in diameter, radially located at angles of n * 45 degrees (0 n 7), and at distances of 150, 250 or 350 pixels (34 pixels/cm). During each trial x- and y-co-ordinates (in pixels) and the system time were sampled. This was done at 50 Hz. 2.2. Subjects Subjects were nine colleagues, five men and four women. The mean age was 29.6 with a standard deviation of 4.5. All subjects were experienced mouse users, but had no experience with trackballs. 2.3. Procedure In the experiment subjects had to click on a button in the center of the screen. A target appeared in one of eight directions and at one of three distances to which the subjects moved the cursor. After the target was reached it disappeared. The next trial started when the button was clicked. 2.4. Design The experiment was divided into three sessions. In each session another device was used, the order of which was random. Each session consisted of a practice and an experimental part. The practice was included to get the subject accustomed to the device and the task. In the practice part each target was presented two times in a random order. In the experimental part each target was presented ten times, also randomly. A session lasted for about 15 minutes. 2.5. Variables Before calculating the curvature and the variability we performed a resampling on the data, because the original sampling was time controlled. This means that velocity of the movement influences the spacing between the samples. To calculate the curvature of a trajectory, however, we want equal spatial distances between the samples, because then every part of the trajectory contributes equally to the calculation of the curvature. Therefore, for each trajectory new samples were calculated, by interpolation, for every one-percent of the total travelled distance (distance of the trajectory itself). To assess the curvature, the paths were first rotated until start and end positions were on the positive xaxis. Then the distance between each calculated coordinate and the x-axis was taken. This distance is equal to the accompanying y-co-ordinate, both with respect to value, sign and unit. Curvature was then defined as the mean value of this distance along the path [1]. E.g., an average distance of +3 means a positive curve of three pixels. The variability of the paths is represented by the standard deviation of all sample points around the mean path of the ten trajectories performed per subject per direction and per device. The standard deviation is calculated over each ten-percent section of the whole path. 3. Results Figure 2 shows the mean paths and the variability around it for each device and each of the three different distances. Standard deviation bars were computed and plotted at every one-tenth path length. From this figure a number of statistics can be derived for both curvature and variability. 3.1. Curvature The mean paths shown in figure 2 look rather straight, but this can not be simply assumed to be the case (as Murata [5] did). We tested the calculated curvature against zero for every direction separately. It was also tested separately per device in order to observe possible systematic effects of the mechanics of each device. Curvature is significantly different from zero on almost every direction for almost every device. Paths made with the mechanical force feedback trackball are three to four times more curved than paths with the other two devices. For the mechanical mouse and the optical trackball curvatures range from –2 till + 6. The optical trackball shows curvature from –8 to +11. However, including a curvature variable into the prediction algorithm will only be effective when the curvature is more than the amount of variability. Looking at Figure 2, this will not be the case. 3.2. Variability An overall mean variability of 12.63 pixels was calculated. A repeated measures ANOVA on variability, with device, distance and direction as within-subjects factors, showed that there is a significant influence from device (F2,7=25.526, p<.01), distance (F2,7=27.866, p<.001) and direction (F7,2=60.770, p<.05) as well as an interaction effect between device and distance (F4,5=7.434, p<.05). Also a significant subjects effect was found (F1,8=296.05, p<.001). Post hoc tests showed that the variability of the paths depends on the first three factors in the following way: (1) direction: for each device the variability in opposite directions equal each other. Also, movements with each device are significantly less variable in horizontal direction than movements in the oblique directions. Vertical movements are somewhat more variable than horizontal movements, but this effect is not significant. (2) distance: the nearest target results in the least variability (10,6 pixels), except for the mechanical force feedback trackball which yields a more complex pattern. -400 002- -200 A )slexip ni( ,y 0 002 002 0 )slexip ni( x 002- 004 004- 200 -200 0 x (in pixels) 200 400 -400 400 -400 -200 -200 -200 0 y, (in pixels) -400 400 -400 0 200 -200 0 x (in pixels) 200 400 -400 400 -200 0 x (in pixels) 200 400 -400 400 -200 -200 -200 400 -400 y, (in pixels) -400 0 200 200 -200 0 x (in pixels) 200 400 400 -400 0 x (in pixels) 200 400 200 -400 0 -200 0 -400 y, (in pixels) y, (in pixels) 0 -400 200 C -200 0 400 -400 c -400 200 y, (in pixels) B y, (in pixels) 004 b y, (in pixels) 004- y, (in pixels) a (3) control device: the overall variability is highest with the optical trackball (16.3 pixels) and lowest with the mechanical mouse (9.7 pixels). These results are comparable with results found in an earlier experiment by Keuning and Houtsma [3]. -200 0 x (in pixels) 200 400 -200 0 x (in pixels) 200 400 0 200 -200 0 x (in pixels) 200 400 400 -400 Figure 2: Mean paths and variability for A. mechanical mouse, B. optical trackball, C. mechanical force feedback trackball, separately for each distance a. 150 pixels, b. 250 pixels, c. 350 pixels. 3.4. Target resolution 3.3. Velocity peak Averaged over all directions, distances, control devices and subjects the peak velocity was reached at 53% of the total distance. A repeated measures ANOVA on the location of peak velocity showed that there is a significant influence of device (F2,7=5.658, p<.05), and distance (F2,7=103.017, p<.001). The mean velocity profiles per device and distance can been seen in figure 3. Also an effect of subjects was found (F1,8=869.12, p<.01). Post hoc tests showed that the influence is as follows: (1) distance: the further away the nearer the peak (49% for the farthest target and 58% for the nearest) . (2) device: the higher the friction of the device the further away the peak is. With the optical trackball having the lowest friction, the peak is at 49% and the mechanical force feedback trackball, having the highest friction, the peak is at 59%). Direction did not (significantly) affect the relative distance of the peak velocity. Figure 3. Velocity profiles of the mechanical mouse (dashed line), the optical trackball (solid line) and the mechanical force feedback trackball (dotted line). Assuming variability for the nearest targets of 10.6 pixels at 50% of the distance, a prediction accuracy of 69% is reached within 7,5 degrees. The farthest targets, having a mean variability of 14.6 pixels, result in a 69% accuracy within 4,5 degrees. Taking the shortest distance as the worst case, targets must be at least 15 degrees (2 times 7,5) away from each other. 4. Discussion and conclusions Since curvatures are not greater than the amount of variability it is not necessary to compensate for it in the general prediction-algorithm. This means that the direction of the users’ target can be assessed from the direction of the initial movement of the cursor. The accuracy of this prediction will depend on the object resolution and on the relative distance whereon the prediction is done. In earlier research it was concluded that the variability climbs to a maximum at 80% of the distance and then falls down rapidly (see [3]). To increase the accuracy of the prediction of the direction one could decrease the distance between objects or change the distance at which a direction prediction is made. Also, multiple predictions can be made along the path. The distance of the target can be assessed by multiplying the distance of the peak velocity by a factor two. An algorithm per device, however, would be preferable. The multiplication factors would then be 100/49, 100/53 and 100/59. A further specialisation is possible if the factor changes when the distance of the peak changes. For each variable the best algorithm would be a subject specific one. It depends on purpose and costs whether this is rewarding. The most important conclusion to be drawn is that creating a useful prediction algorithm seems to be possible. A prediction of the target distance is possible when the cursor is about halfway. A prediction of the correct direction appears possible in an even earlier stage. 4. References [1] Boessekool, J. (1999). Moving two hands. PhD thesis, Utrecht University, the Netherlands [2] Engel, F., Goossens, P. and Haakma, R. (1994). Improved efficiency through I- and e-feedback: a trackball with contextual force feedback. Int. J. Human-Computer Studies, 41, 949-974. [3] Keuning, H. and Houtsma, A.J.M. (2000). Cursor trajectory analysis. Proceedings of the First international symposium on haptic human-computer interaction, Glasgow, 69-72. [4] Keyson, D. (1997). Touch in user interface navigation. Ph.D. thesis, technical University Eindhoven, The Netherlands. [5] Murata, A. (1998). Improvement of pointing time by predicting targets in pointing with a mouse. Int. J. of Human-Computer Interaction, 10(1), 23-32.

