VIII. Ischemia, Injury, and Infarction
advertisement
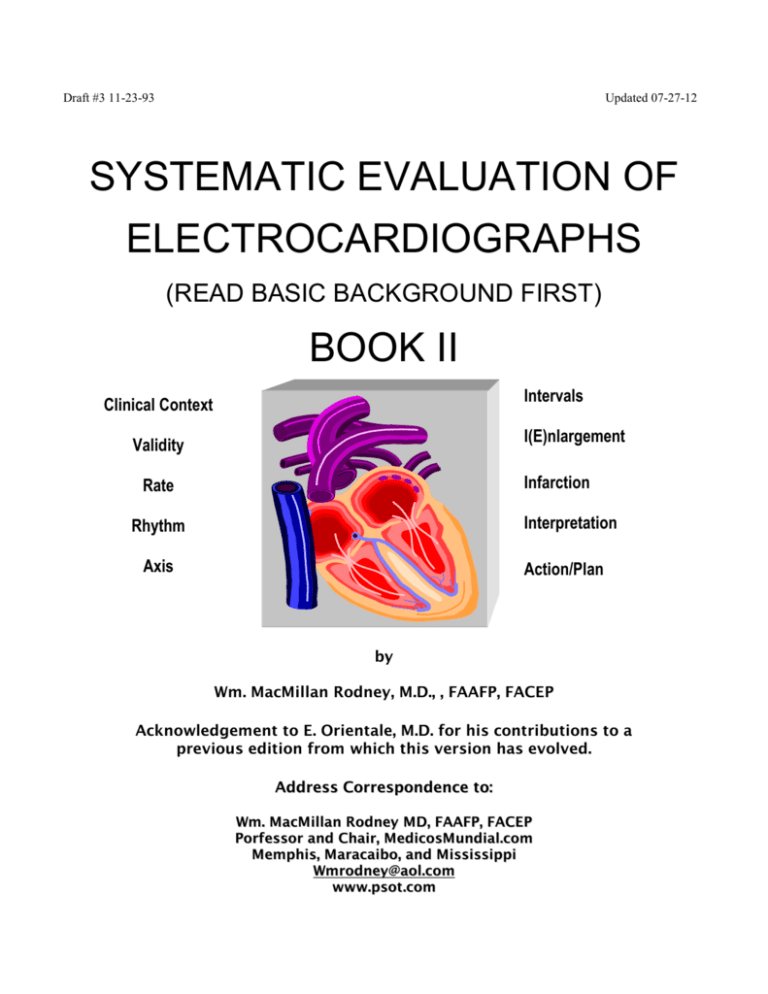
Draft #3 11-23-93 Updated 07-27-12 SYSTEMATIC EVALUATION OF ELECTROCARDIOGRAPHS (READ BASIC BACKGROUND FIRST) BOOK II Intervals Clinical Context I(E)nlargement Validity Infarction Rate Interpretation Rhythm Axis Action/Plan by Wm. MacMillan Rodney, M.D., , FAAFP, FACEP Acknowledgement to E. Orientale, M.D. for his contributions to a previous edition from which this version has evolved. Address Correspondence to: Wm. MacMillan Rodney MD, FAAFP, FACEP Porfessor and Chair, MedicosMundial.com Memphis, Maracaibo, and Mississippi Wmrodney@aol.com www.psot.com Systematic Evaluation . . . 1 SYSTEMATIC EVALUATION OF ELECTROCARDIOGRAPHS TABLE OF CONTENTS I. CLINICAL CONTEXT II. VALIDITY III. RATE IV. RHYTHM V. AXIS VI. INTERVALS VII. I(E)NLARGEMENT VIII. ISCHEMIA, INJURY, AND INFARCTION IX. INTERPRETATION X. ACTION/PLAN Systematic Evaluation . . . I. 2 Clinical Context The most important component for accurately interpreting an ECG and managing the patient is the clinical context in which the test is ordered. The same ECG can have two valid but different plans for management if obtained from patients with different clinical presentations. An example of this would be an ECG in a 60 year-old male who has substernal chest pain (plus a history of HTN, a 40-pack a year smoking history, hypercholesterolemia, diabetes, and a father who died of a myocardial infarction at age 62) which is compared to an ECG from a healthy 28 year old professional basketball player obtained as part of a routine physical. Both may have ST segment elevation in the anterior leads. One is having an anterior wall infarction; the other is asymptomatic and has early repolarization abnormality. The ECG's may appear the same. The clinical context determines the correct managment which is different than "interpretation". II. Validity Validity can be quickly checked by observing these four points: A. The ECG is labeled with the patient’s name and the date. B. Limb Lead I is almost a mirror image of AVR. C. The presence of a voltage standardization mark that is two big boxes tall (ten millimeters) in response to a 1 millivolt (mv) stimulus, and is five small boxes wide—implying a rate of 25 mm/sec. D. R-wave progression in the chest leads reveals a more prominent R-wave by Lead V4. The rV4 in mm should be > the sV4. Exceptions exist. For example, R-wave progression is lost in an anterior wall infarction. The ECG is still valid. An alternative explanation exists for the loss of R-wave progression; the anterior myocardium has been damaged. III. Rate The rate may be calculated by noting the interval between QRS complexes and memorizing the following: A. One large box (200 milliseconds, 0.2 seconds) yields a rate of 300 beats per minute (bpm). B. Two large boxes is a rate of 150 bpm. C. Three large boxes is a rate of 100 bpm. D. Four large boxes is a rate of 75 bpm. E. Five large boxes is a rate of 60 bpm. F. Six large boxes is a rate of 50 bpm. G. Seven large boxes is a rate of 43 bpm. H. Eight large boxes is a rate of 37 bpm. Note that all of the rates are the result of the following formula: Rate = 300/# of large boxes between R-waves. Systematic Evaluation . . . 3 In addition, the rate may be estimated by counting all the R-waves in six seconds and multiplying by ten. Some ECG paper has marks at the top of the paper every three seconds. This technique is often helpful in estimating the rate in a patient with an irregular rhythm. IV. Rhythm A. To determine the rhythm, the following question must be answered: 1. Is the QRS rate regular? 2. Is a P-wave present and is it associated in a regular fashion with the QRS wave? 3. Is the QRS narrow (<120 msec) or wide (> 120 msec). B. Sinus rhythms: narrow complex QRS 1. All P-waves should be uniform in appearance. 2. Examples. a. NSR: normal sinus rhythm. Upright P-wave in Lead II and rate of 60 to 100. b. Sinus bradycardia. Upright P-wave in Lead II and rate < 60. c. Sinus tachycardia. Upright P-wave in Lead II and rate > 100. d. Sinus arrhythmia (also known as sinus dysrhythmia). Upright P-wave in Lead II and variable rate normally between 60 and 100. In this normal variant, the rate varies +/- 10% over an average of one minute. For example, if the average pulse is 76 bpm, in sinus arrythmia, the rate may range from 68-84 (76 +/- 7.6) bpm. The following rhythms are included for completeness. But they are not the focus of this course on static electrocardiogram interpretations. The diagnosis and management of these rhythms are taught in a separate course called Advanced Cardiac Life Support (ACLS). C. Other supraventricular rhythms: narrow complex QRS 1. Atrial fibrillation. No P-waves are discernible. The ventricular response is irregularly irregular. Rate is variable and usually between 60 to 120. Rates >120 and <60 are often symptomatic. 2. Atrial flutter. An organized atrial depolarization at a rate of 300 with a sawtooth pattern. Ventricular response can be 300, 150, 100 in a 1:1, 2:1, 3:1 pattern. This may present as a regular or an irregularly irregular pattern. Ventricular response may also vary with a variable AV block. 3. PSVT (paroxysmal supraventricular tachycardia). A regular supraventricular tachycardia with rates between 150 and 220. If a P-wave is discernible, the form should be constant. 5. WAP (wandering atrial pacemaker). A normal rate (60-100) but multifocal Pwaves; i.e., at least three P-waves with different shapes and variable PR intervals in the same leads. 6. MAT (multifocal atrial tachycardia). Similar to WAP but a tachycardia with rates 100-200. Systematic Evaluation . . . 7. 8. 9. D. V. 4 Junctional rhythm. No P-wave is present or related to the QRS complex. Rate is 40-60. If rate 60-100, it is called an accelerated junctional rhythm. If >100, it is called a junctional tachycardia. PAC (premature atrial contraction). These are isolated complexes which occur before the normal sinus beat. The P-wave has a different form. A compensatory pause with a normally spaced sinus beat follows a PAC. PJC (premature junctional beat). Like a PAC, compensatory pause follows a PJC, but no P-wave precedes the QRS complex. WARNING: Compensatory pauses are tricky and exceptions to this rule exist. Ventricular rhythms: Wide complex QRS. QRS duration is prolonged and > 120 msec in duration. 1. PVC (premature ventricular contraction). An ectopic ventricular focus erupts prior to the regular rhythm. Again, a compensatory pause follows. 2. Idioventricular escape rhythm. One ventricular focus fires between 20-40. 3. AIVR (accelerated idioventricular rhythm). Again, a single ventricular focus at a rate of 40-119. 4. Ventricular tachycardia. A wide complex tachycardia with a rate >120. 5. Ventricular fibrillation. A disorganized firing of the ventricle which produces no discernible wave forms and no pulse. Fine and coarse variations exist. QRS duration, if discernible, is variable. Axis Axis can be easily determined by using three limb leads: I, AVF, and II. If the QRS is more positive in Lead I, the axis must be between -90 and +90. If the QRS is also positive in AVF, the axis must be between 0 and +180. The intersection of these two leads is 0 to +90. Thus, if the QRS is positive in both Leads I and AVF, the axis is "normal" and somewhere between 0 and 90. If the QRS is positive in Lead I and negative in AVF, the intersection is between 0 and -90. Then, Lead II becomes helpful in determining the axis. If the QRS is positive in Lead II, the axis is between -30 and 0. If the QRS in Lead II is negative, the axis will be -30 or less. Some have defined a Normal axis as -29 to +89. But this course clearly defines 0 - 900 as normal. Remember to be explicit about boundary rules. Left axis deviation (LAD) is < 00 and < -30 and has no distinct pathologic correlation. An axis between 0 through -30 may also be called a leftward axis. Right axis deviation is > or = +90. Left anterior hemiblock (LAHB) is diagnosed when the axis is less than -300 (i.e., -310) and no other reason for an axis shift is present. By definition, LAHB is LAD. Other synonyms include left anterior superior hemiblock (LASH) and (LAFB). WARNING: These rules are generalizations based on consensus, not unanimity. In other words, not all physicians agree on these boundary rules. Systematic Evaluation . . . VI. 5 Intervals Three intervals are most important: the PR Interval, the QRS interval, and the QT interval. A. PR Interval--This is the key to reading 1st degree, 2nd degree, and 3rd degree atrioventricular (AV) block. A PR interval is measured from the start of the P-wave to the beginning of the QRS complex. A normal PR interval is <200 msec or 0.2 sec or one large box or five small boxes. First degree AV block is a PR interval of >200 msec. Second degree AV block is divided into two classes: Mobitz Type I or Wenckebach and Mobitz Type II or non-Wenkebach. In Mobitz Type I, the PR interval gradually increases until a QRS is dropped. In Mobitz II, the PR interval is constant, but the QRS complex is still dropped. Third degree AV block is complete disassociation of the atria with the ventricles; i.e., the P-wave with the QRS. Here, no signal is transmitted via the AV node and the His-Purkinje system. The rate would depend on the escape rhythm. This produces independent atrial and ventricular rhythms. B. QRS Interval--This is the key to reading bundle branch block (BBB). A QRS interval is measured from the start of the Q-wave to the end of the S-wave. A normal QRS is <120 msec or three small boxes. A QRS between 100 msec or 119 msec has been called incomplete bundle branch block. (Dr. Rodney and most cardiologists do not feel this is clinically significant diagnosis, and they dismiss it.) The terminology “incomplete bundle branch block” was widely taught prior to 1990, but it has been dropped by most physicians because it lacks clinical meaning. Intraventricular Conduction Defect (IVCD) is a term describing all of the BBB syndromes ncluding LBBB, RBBB, and most fo the pre-excitation syndromes[e.g. WPW and others.} For the purposes of this course, we are defining an abnormally long QRS interval as greater than or equal to 120 msec. (JAMA 1999; 281:715 uses more than 120 msec and Jarcho JA. New Engl J Med 2006;355:299-294] A QRS > or = 120 msec defines bundle branch block, an abnormal ventricular beat such as a PVC, or a ventricular rhythm. Three leads are helpful in the delineation of bundle branch block etiology: I, V1, and V6. Leads I and V6 measure forces toward the left side of the heart. Lead V1 is over the right side of the heart. The QRS changes from a right bundle branch block (RBBB) would be more obvious here. Examining the “late” QRS forces will help determine whether a RBBB or LBBB exists. Late peaking R waves in the lateral leads would suggest a LBBB; late peaking R waves in the anterior leads (the R’ or Rabbit ears) would suggest a RBBB. Leads that show abnormal depolarization will also show abnormal repolarization; look for T wave inversion or ST depression in these leads. Systematic Evaluation . . . C. 6 QT Interval --This is the key to determining repolarization delays which may reflect drug toxicity and/or risk of sudden death. A QT interval is measured from the start of the QRS complex to the end of the T-wave. At normal rates (60 to -100), the QT can be called normal if the QT interval is less than half of the RR interval. At other rates, the QT must be measured and compared to charts of normal values. Causes of prolonged QT intervals include: Type 1A antiarrhythmics, tricyclic antidepressants, phenothiazines, hypokalemia, hypocalcemia, hypomagnesemia, and CNS depression. Shortened QT intervals can be seen in the setting of hypercalcemia. VII. (I) Enlargement Right Atrial Abnormality (RAA) is also known as RAE (right atrial enlargement) and RAH (right atrial hypertrophy). It was previously known as P-pulmonale. Since atrial depolarization is typically greatest in the direction of Lead II, a peaked P-wave of > or = 2.5 small boxes is diagnostic of RAA. Leads III and AVF are also used with this criteria. Left Atrial Abnormality (LAA) is also known as LAE and LAH (left atrial enlargement and left atrial hypertrophy). Another name for this abnormality is P mitrale. Here, the P-waves in Leads II, I, or L are prolonged to 120 msec or 0.12 sec or three small boxes. In addition, the terminal negative component of the P-wave in V1 can contain one small box and typically has a sinusoidal wave appearance Right Ventricular Hypertrophy (RVH) must be suspected in the presence of a prominent Rwave in Lead V1 or V2; i.e., the R-wave must be greater than the S-wave. In addition, right axis deviation (RAD) and right atrial abnormality (RAA) must be present. Other associated findings include, incomplete RBBB, and right ventricular strain. Left Ventricular Hypertrophy (LVH) can be diagnosed by using multiple criteria. 1) Chest lead criteria include the addition of the S-wave from V1 or V2to the R-wave of V5 or V6. A sum of > 35 is positive in patients 35 years of age or older. 2) Limb lead criteria include the sum of the R-wave in Lead I and the S-wave in Lead III > 25. 3) Also, any R-wave in Lead AVL > 12. The presence of a strain pattern makes the diagnosis more certain. LAD is often seen with LVH. These criteria are not necessarily valid in patients less than 35 years of age. WARNING: Enlargement criteria on ECG are valid clinical signs of probable heart disease, but they have low sensitivity and specificity when compared to echocardiography. VIII. Ischemia, Injury, and Infarction A. Ischemia is cellular hypoxia. Cells are not irreparably damaged. Ischemia is typically manifested by ST-segment depression and/or T-wave inversion. B. Injury is cellular damage, but some, if not all, of the cells can recover. Injury is manifested by ST-segment elevation and hyper-acute or tombstone-appearing T-waves. Systematic Evaluation . . . C. 7 Infarction is cellular death. Cells cannot be repaired. Infarction is manifested by loss of R-wave forces and by the development of Q-waves in leads consistent with vascular supply. Examples of this include Leads II, III, and AVF for inferior infarctions. Leads I, AVL, V5-6 will show changes in a lateral infarction. Leads V1-3 will show changes in an anterior infarction. Significant Q waves are a minimum of one small box wide or are 1/4 to 1/3 the height of the R wave. The latter criterion lacks validity when the R wave is small (i.e., 5mm or less). Any injury pattern that encompasses all major vessel distributions should lead to the suspicion of pericarditis. IX. Interpretation The interpretation is the summation of all the abnormalities found in the previous sections as they relate to the patient's clinical context. SUGGESTION: The interpretation area of the ECG Interpretation Form (See attached) can be used as a notepad gathering abnormalities as each step (1-8) is completed. VII. Plan—Clinical Management. What Action Should the Physician Initiate, if Any? Should the patient be admitted to the hospital or can the patient go home? After you have interpreted the ECG, you must incorporate your result into the treatment plan for the patient. This step allows you to document your clinical plan in light of your ECG interpretation. Systematic Evaluation . . . 8 ECG Interpretation Report Method of Wm. MacMillan Rodney, M.D.,FAAFP, FACEP (Rev April 2009) Please fill out form completely. This helps us in caring for the patient. Patient Name: Location: Patient ID#: Date of Tracing: I. CLINICAL CONTEXT: A. Patient Age, Race, Sex, and Reason ECG was Ordered B. Past Medical History History of heart disease? Current Medications: (Circle) Digitalis Quinidine CA Channel Blocker Beta Blocker II. Yes No Diuretics Antidepressants Thyroid Other VALIDITY: TECHNICAL QUALITY OF TRACING Patient name, date on ECG? Lead placement correct, voltage standardized? III. IV. RHYTHM (include PAC’s and/or PVC’s): RATE (include PAC’s and/or PVC’s): V. QRS AXIS (Circle One) a) 0o to +90o Yes Yes b) No No <0o to –30o c) Less Than –30o (i.e., -31o) o o d) +91 to +180 e) VI. Indeterminate INTERVALS (Measure) PR QRS QT msec msec msec Is it normal? Is it normal? Is it normal? Yes Yes Yes VII. VIII. ENLARGEMENT patterns (LAA, RAA, LVH, RVH) present? ISCHEMIA, INJURY, INFARCTION or strain patterns present? IX. INTERPRETATION:_________________________________________________________ X. Old ECGS for comparison? Yes No Any change from previous tracing? Yes No PLAN OF ACTION: ____________________________________________________________________________ Interpreted by: _________________________M.D./D.O. Yes Yes No No No No No
