Table - Figshare
advertisement
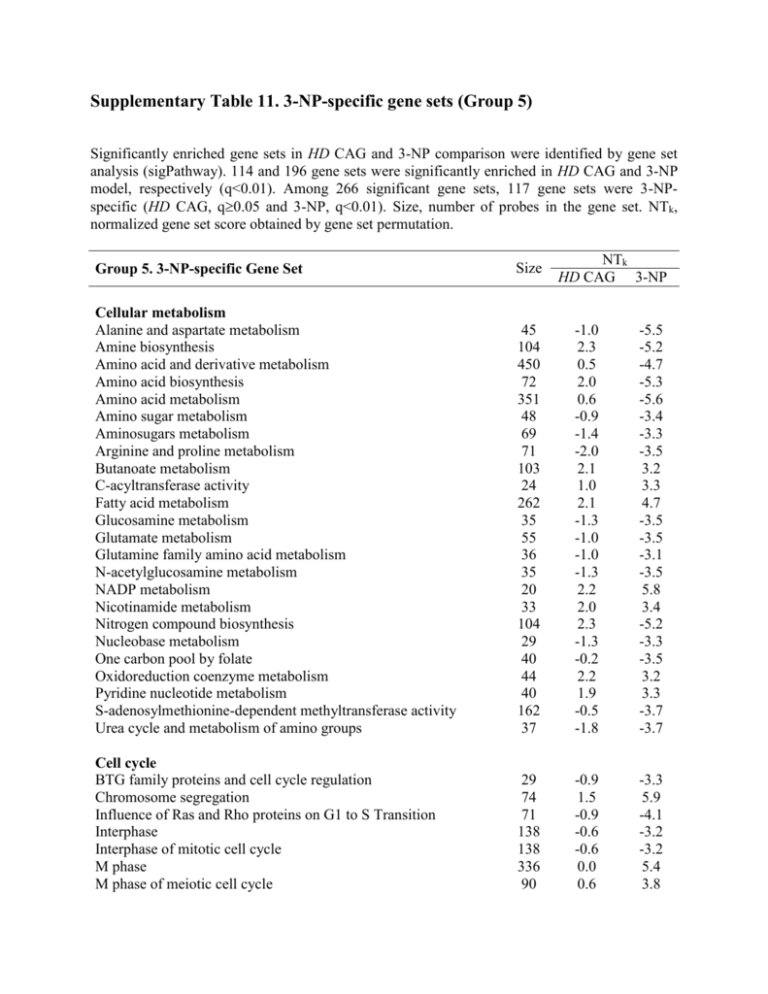
Supplementary Table 11. 3-NP-specific gene sets (Group 5) Significantly enriched gene sets in HD CAG and 3-NP comparison were identified by gene set analysis (sigPathway). 114 and 196 gene sets were significantly enriched in HD CAG and 3-NP model, respectively (q<0.01). Among 266 significant gene sets, 117 gene sets were 3-NPspecific (HD CAG, q0.05 and 3-NP, q<0.01). Size, number of probes in the gene set. NTk, normalized gene set score obtained by gene set permutation. NTk HD CAG 3-NP Group 5. 3-NP-specific Gene Set Size Cellular metabolism Alanine and aspartate metabolism Amine biosynthesis Amino acid and derivative metabolism Amino acid biosynthesis Amino acid metabolism Amino sugar metabolism Aminosugars metabolism Arginine and proline metabolism Butanoate metabolism C-acyltransferase activity Fatty acid metabolism Glucosamine metabolism Glutamate metabolism Glutamine family amino acid metabolism N-acetylglucosamine metabolism NADP metabolism Nicotinamide metabolism Nitrogen compound biosynthesis Nucleobase metabolism One carbon pool by folate Oxidoreduction coenzyme metabolism Pyridine nucleotide metabolism S-adenosylmethionine-dependent methyltransferase activity Urea cycle and metabolism of amino groups 45 104 450 72 351 48 69 71 103 24 262 35 55 36 35 20 33 104 29 40 44 40 162 37 -1.0 2.3 0.5 2.0 0.6 -0.9 -1.4 -2.0 2.1 1.0 2.1 -1.3 -1.0 -1.0 -1.3 2.2 2.0 2.3 -1.3 -0.2 2.2 1.9 -0.5 -1.8 -5.5 -5.2 -4.7 -5.3 -5.6 -3.4 -3.3 -3.5 3.2 3.3 4.7 -3.5 -3.5 -3.1 -3.5 5.8 3.4 -5.2 -3.3 -3.5 3.2 3.3 -3.7 -3.7 Cell cycle BTG family proteins and cell cycle regulation Chromosome segregation Influence of Ras and Rho proteins on G1 to S Transition Interphase Interphase of mitotic cell cycle M phase M phase of meiotic cell cycle 29 74 71 138 138 336 90 -0.9 1.5 -0.9 -0.6 -0.6 0.0 0.6 -3.3 5.9 -4.1 -3.2 -3.2 5.4 3.8 M phase of mitotic cell cycle Meiosis Meiotic cell cycle Mitosis Polyamine metabolism 262 90 90 261 32 0.0 0.6 0.6 0.1 0.0 4.2 3.8 3.8 4.5 -3.1 Structure molecule / Adhesion Actin cytoskeleton Adhesion Molecules on Lymphocyte Cell-matrix adhesion Extracellular Matrix Adhesion Molecules Focal adhesion Microtubule 458 22 130 218 61 362 0.8 2.0 0.9 0.2 2.4 1.5 -3.4 -3.4 -3.1 -5.1 -3.5 3.2 55 225 244 313 135 139 260 428 206 51 253 20 -2.4 -1.0 0.5 -2.1 -1.5 2.4 -0.1 1.5 -0.6 2.4 -1.4 0.5 -3.8 -4.7 -3.4 -3.1 -6.0 -3.3 -3.4 4.1 -4.1 -6.0 -5.1 -3.2 452 202 166 73 104 498 193 1.3 -0.3 -1.8 -1.7 1.4 -0.8 -0.6 3.8 -4.1 -3.9 -3.7 -4.0 -3.3 -6.7 369 480 60 349 349 349 -0.2 -0.3 0.4 -0.7 -0.7 -0.7 5.4 4.4 3.1 5.1 5.1 5.1 70 70 -0.8 -0.8 -5.5 -5.5 Signaling ATM Signaling Pathway Breast Cancer Estrogen Receptor Signaling Ca NFAT Signaling Pathways GTPase activator activity HIV-I Nef negative effector of Fas and TNF Kinase regulator activity MAP Kinase Signaling Pathway Neuroactive ligand-receptor interaction NFkB Signaling Pathway P53 Signaling Pathway P53 Signaling Pathway Regulation of MAP Kinase Pathways Through Dual Specificity Phosphatases Rhodopsin-like receptor activity Signal Transduction in Cancer Signal Transduction PathwayFinder Signal transduction through IL1R Signaling of Hepatocyte Growth Factor Receptor Small GTPase mediated signal transduction Stress Toxicity PathwayFinder RNA metabolism RNA splicing mRNA processing mRNA splice site selection Nuclear mRNA splicing, via spliceosome RNA splicing, via transesterification reactions RNA splicing, via transesterification reactions with bulged adenosine as nucleophile rRNA metabolism rRNA processing tRNA metabolism RNA ligase activity RNA modification 138 102 98 0.9 1.8 2.3 -6.3 -6.1 -6.4 213 397 43 1.7 -1.8 -1.1 -3.4 -3.5 -3.9 231 102 102 113 171 148 -0.5 1.8 1.8 1.6 0.0 2.4 3.3 -6.1 -6.1 -5.9 6.4 9.9 35 0.3 6.4 26 2.2 5.4 23 -0.3 -3.2 Translation / tRNA Aminoacyl-tRNA synthetases Translational initiation Translation factor activity, nucleic acid binding tRNA ligase activity tRNA modification translation regulator activity tRNA aminoacylation for protein translation tRNA aminoacylation Translation initiation factor activity Translation 40 109 250 102 86 259 80 80 165 303 1.4 -1.5 -1.8 1.8 1.9 -1.9 2.0 2.0 -2.3 -0.5 -6.7 -5.1 -4.9 -6.1 -6.6 -4.8 -6.2 -6.2 -5.4 -6.2 Others Agrin in Postsynaptic Differentiation Amino acid activation Aangiogenesis Cancer PathwayFinder Cardiovascular Disease Chromosome, pericentric region Inner membrane 96 80 192 235 309 89 291 -0.5 2.0 2.3 1.0 0.3 -0.7 -0.6 -3.3 -6.2 -3.9 -6.7 -4.7 3.7 -3.1 Enzyme activity Cancer Drug Resistance Metabolism Enzyme activator activity Hydrolase activity, acting on carbon-nitrogen (but not peptide) bonds, in cyclic amidines Isomerase activity Ligase activity, forming aminoacyl-tRNA and related compounds Ligase activity, forming carbon-oxygen bonds Ligase activity, forming phosphoric ester bonds Monooxygenase activity Oxidoreductase activity, acting on paired donors, with incorporation or reduction of molecular oxygen Oxidoreductase activity, acting on paired donors, with incorporation or reduction of molecular oxygen, 2-oxoglutarate as one donor, and incorporation of one atom each of oxygen into both donors Oxidoreductase activity, acting on paired donors, with incorporation or reduction of molecular oxygen, NAD or NADH as one donor, and incorporation of one atom of oxygen Oxidoreductase activity, acting on the CH-NH group of donors, NAD or NADP as acceptor Integrin binding Iron ion binding Kinetochore L-ascorbic acid binding Late endosome Monocyte and its Surface Molecules Nucleolus Protein targeting Protein transporter activity Regulation of gene expression, epigenetic Sex differentiation Small ribosomal subunit Transcriptional activator activity Tumor Metastasis Tumor Suppressor Arf Inhibits Ribosomal Biogenesis uCalpain and friends in Cell spread 30 419 47 25 51 26 185 482 326 107 103 89 163 220 31 39 -1.5 2.0 0.7 -1.0 1.1 1.9 -0.8 -0.7 -1.9 0.8 0.1 -2.1 -2.4 1.3 -0.8 -0.2 -3.6 5.7 3.3 6.1 -4.7 -3.3 -5.6 -3.2 -4.0 3.3 3.2 -3.2 -4.2 -7.5 -3.3 -3.3
