ddi12276-sup-0002-TableS1-S2
advertisement
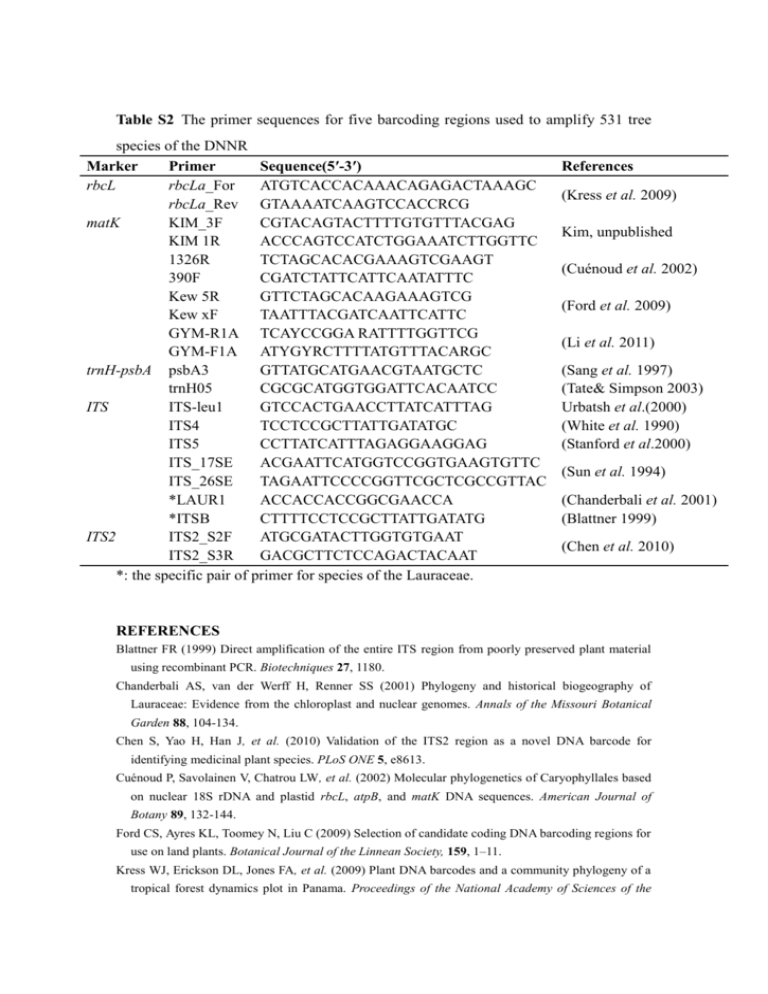
Table S2 The primer sequences for five barcoding regions used to amplify 531 tree species of the DNNR Marker Primer Sequence(5′-3′) rbcL rbcLa_For ATGTCACCACAAACAGAGACTAAAGC rbcLa_Rev GTAAAATCAAGTCCACCRCG matK KIM_3F CGTACAGTACTTTTGTGTTTACGAG KIM 1R ACCCAGTCCATCTGGAAATCTTGGTTC 1326R TCTAGCACACGAAAGTCGAAGT 390F CGATCTATTCATTCAATATTTC Kew 5R GTTCTAGCACAAGAAAGTCG Kew xF TAATTTACGATCAATTCATTC GYM-R1A TCAYCCGGA RATTTTGGTTCG GYM-F1A ATYGYRCTTTTATGTTTACARGC trnH-psbA psbA3 GTTATGCATGAACGTAATGCTC trnH05 CGCGCATGGTGGATTCACAATCC ITS ITS-leu1 GTCCACTGAACCTTATCATTTAG ITS4 TCCTCCGCTTATTGATATGC ITS5 CCTTATCATTTAGAGGAAGGAG ITS_17SE ACGAATTCATGGTCCGGTGAAGTGTTC ITS_26SE TAGAATTCCCCGGTTCGCTCGCCGTTAC *LAUR1 ACCACCACCGGCGAACCA *ITSB CTTTTCCTCCGCTTATTGATATG ITS2 ITS2_S2F ATGCGATACTTGGTGTGAAT ITS2_S3R GACGCTTCTCCAGACTACAAT *: the specific pair of primer for species of the Lauraceae. References (Kress et al. 2009) Kim, unpublished (Cuénoud et al. 2002) (Ford et al. 2009) (Li et al. 2011) (Sang et al. 1997) (Tate& Simpson 2003) Urbatsh et al.(2000) (White et al. 1990) (Stanford et al.2000) (Sun et al. 1994) (Chanderbali et al. 2001) (Blattner 1999) (Chen et al. 2010) REFERENCES Blattner FR (1999) Direct amplification of the entire ITS region from poorly preserved plant material using recombinant PCR. Biotechniques 27, 1180. Chanderbali AS, van der Werff H, Renner SS (2001) Phylogeny and historical biogeography of Lauraceae: Evidence from the chloroplast and nuclear genomes. Annals of the Missouri Botanical Garden 88, 104-134. Chen S, Yao H, Han J, et al. (2010) Validation of the ITS2 region as a novel DNA barcode for identifying medicinal plant species. PLoS ONE 5, e8613. Cuénoud P, Savolainen V, Chatrou LW, et al. (2002) Molecular phylogenetics of Caryophyllales based on nuclear 18S rDNA and plastid rbcL, atpB, and matK DNA sequences. American Journal of Botany 89, 132-144. Ford CS, Ayres KL, Toomey N, Liu C (2009) Selection of candidate coding DNA barcoding regions for use on land plants. Botanical Journal of the Linnean Society, 159, 1–11. Kress WJ, Erickson DL, Jones FA, et al. (2009) Plant DNA barcodes and a community phylogeny of a tropical forest dynamics plot in Panama. Proceedings of the National Academy of Sciences of the United States of America 106, 18621-18626. Li Y, Gao L-M, Poudel RC, Li D-Z, Forrest A (2011) High universality of matK primers for barcoding gymnosperms. Journal of Systematics and Evolution 49, 169-175. Sang T, Crawford D, Stuessy T (1997) Chloroplast DNA phylogeny, reticulate evolution, and biogeography of Paeonia (Paeoniaceae). American Journal of Botany 84, 1120-1120. Sun Y, Skinner D, Liang G, Hulbert S (1994) Phylogenetic analysis of Sorghum and related taxa using internal transcribed spacers of nuclear ribosomal DNA. Theoretical and Applied Genetics 89, 26-32. Tate JA, Simpson BB (2003) Paraphyly of Tarasa (Malvaceae) and diverse origins of the polyploid species. Systematic Botany 28, 723-737. White TJ, Bruns T, Lee S, Taylor J (1990) Amplification and direct sequencing of fungal ribosomal RNA genes for phylogenetics. PCR protocols: a guide to methods and applications 18, 315-322. Table S3 Species composition of seven Asian forest dynamics plots (Data from: Center for Tropical Forest Science, www.ctfs.si.edu; elevation less than 1000 m and plot size between 10 ha and 50 ha) CTFS Plot Location Latitude (N) Elevation (m) Plot Size Number of Species Number of genus Number of large genera* Number of species (large genera*) (species ratio) Pasoh, (Malaysia) Lambir, (Malaysia) 2°58′ 70-90 50 ha 814 299 79 550 (67.57%) 4°11′ 104-244 52 ha 1182 290 110 943 (79.78%) Palanan, (Philippines) 17°2′ 85-140 16 ha 335 159 30 163(48.66%) Xishuangbana, (China) Dinghushan, (China) 21°36′ 709-869 20 ha 470 210 50 264 (56.17%) 23°10′ 230-470 20 ha 190 115 18 82 (41.41%) Gutianshan, (China) 29°15′ 446-714 24 ha 159 103 9 42 (26.42 %) Changbaishan, (China) 42°16′ 791-809 25 ha 52 35 1 8 (5.4%) *: Large genera indicate the genera containing more than two species per genus. Figure S1 Comparision of the performance of DNA barcode regions and their combinations for distinguinshing species, genera and families, accounting for sequence recoverability, using BLASTn at the DNNR. Figure S2. Species resolution (NJ analysis) of DNA barcode regions and their combinations at species, genus and family levels in the DNNR (Bootstrap support value exceeded 70% and based on 1000 bootstrap replicates).
