Sonar Models Maths Paper_small
advertisement
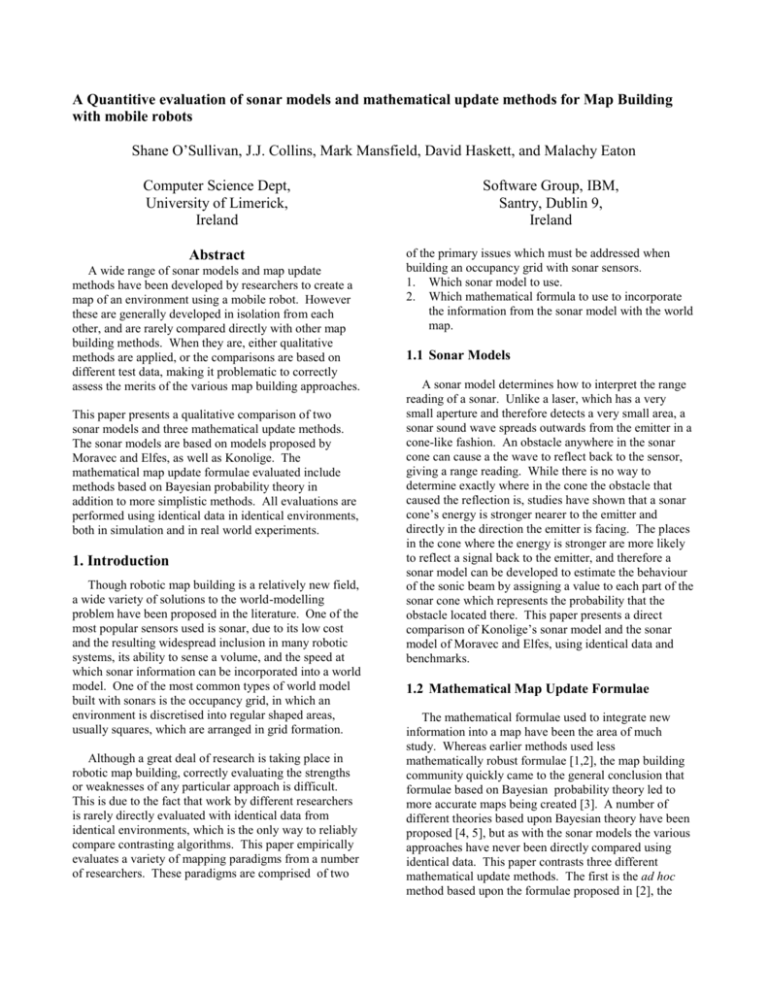
A Quantitive evaluation of sonar models and mathematical update methods for Map Building with mobile robots Shane O’Sullivan, J.J. Collins, Mark Mansfield, David Haskett, and Malachy Eaton Computer Science Dept, University of Limerick, Ireland Software Group, IBM, Santry, Dublin 9, Ireland Abstract of the primary issues which must be addressed when building an occupancy grid with sonar sensors. 1. Which sonar model to use. 2. Which mathematical formula to use to incorporate the information from the sonar model with the world map. A wide range of sonar models and map update methods have been developed by researchers to create a map of an environment using a mobile robot. However these are generally developed in isolation from each other, and are rarely compared directly with other map building methods. When they are, either qualitative methods are applied, or the comparisons are based on different test data, making it problematic to correctly assess the merits of the various map building approaches. This paper presents a qualitative comparison of two sonar models and three mathematical update methods. The sonar models are based on models proposed by Moravec and Elfes, as well as Konolige. The mathematical map update formulae evaluated include methods based on Bayesian probability theory in addition to more simplistic methods. All evaluations are performed using identical data in identical environments, both in simulation and in real world experiments. 1. Introduction Though robotic map building is a relatively new field, a wide variety of solutions to the world-modelling problem have been proposed in the literature. One of the most popular sensors used is sonar, due to its low cost and the resulting widespread inclusion in many robotic systems, its ability to sense a volume, and the speed at which sonar information can be incorporated into a world model. One of the most common types of world model built with sonars is the occupancy grid, in which an environment is discretised into regular shaped areas, usually squares, which are arranged in grid formation. Although a great deal of research is taking place in robotic map building, correctly evaluating the strengths or weaknesses of any particular approach is difficult. This is due to the fact that work by different researchers is rarely directly evaluated with identical data from identical environments, which is the only way to reliably compare contrasting algorithms. This paper empirically evaluates a variety of mapping paradigms from a number of researchers. These paradigms are comprised of two 1.1 Sonar Models A sonar model determines how to interpret the range reading of a sonar. Unlike a laser, which has a very small aperture and therefore detects a very small area, a sonar sound wave spreads outwards from the emitter in a cone-like fashion. An obstacle anywhere in the sonar cone can cause a the wave to reflect back to the sensor, giving a range reading. While there is no way to determine exactly where in the cone the obstacle that caused the reflection is, studies have shown that a sonar cone’s energy is stronger nearer to the emitter and directly in the direction the emitter is facing. The places in the cone where the energy is stronger are more likely to reflect a signal back to the emitter, and therefore a sonar model can be developed to estimate the behaviour of the sonic beam by assigning a value to each part of the sonar cone which represents the probability that the obstacle located there. This paper presents a direct comparison of Konolige’s sonar model and the sonar model of Moravec and Elfes, using identical data and benchmarks. 1.2 Mathematical Map Update Formulae The mathematical formulae used to integrate new information into a map have been the area of much study. Whereas earlier methods used less mathematically robust formulae [1,2], the map building community quickly came to the general conclusion that formulae based on Bayesian probability theory led to more accurate maps being created [3]. A number of different theories based upon Bayesian theory have been proposed [4, 5], but as with the sonar models the various approaches have never been directly compared using identical data. This paper contrasts three different mathematical update methods. The first is the ad hoc method based upon the formulae proposed in [2], the second uses the Bayesian update formula as presented in [3], and the third is the modified Bayesian update formulae using log odds presented in [4]. is the angle between the main axis of the beam and the line SP. R is the range reading – the distance the sonar beam travelled before it bounced off an object 2. Sonar Models Two sonar models are quantitively contrasted in this paper. The first is the two dimensional gaussian sonar model proposed by Moravec and Elfes [2]. The second is the sonar model designed by Konolige [4], the multiple target model, which is based on the normal distribution. This paper is not intended to be an in depth discussion of these sonar models, for that see the source papers. However, an overview of the models is given below. Each of these models translates a sonar range reading into a set of values which must applied to a set of cells in a map. The mathematical formulae used to perform this cell update procedure are discussed in section three. 2.1 Two Dimensional Gaussian Sonar Model A sonar beam contains information which pertains to an area, rather than a point, regardless of whether it strikes an obstacle or not. The two dimensional gaussian (2DG) model represents a sonar range reading as a segment, as in Fig 1. The beam is divided into two parts, the freespace area and the surface (obstacle) area. The freespace area is the part of the beam between the sensor and the range the obstacle was detected at, i.e. the unshaded area in Fig 1. There is always some uncertainty as to the exact distance an obstacle was measured at, which lead to the introduction of the value . It is also unknown where on the arc the obstacle is. For these two reasons, the occupied part of the beam is represented by the shaded area in Fig 1, covering the full arc of the beam, and wide to represent the range uncertainty. 2.1.1 Freespace Updates with the 2D gaussian sonar model A cell which is inside the freespace area of the beam has its freespace probability increased with the value PE(X,Y), using the formula: PE(X,Y) = Er() * Ea() Er() is the estimation of the cell’s freespace based on its range from the sensor. The closer it is to the sensor, the more likely that it is not occupied. 1 R min R R min 2 for R min R E r ` 0 otherwise Ea() is the estimation that a cell is unoccupied based on the difference in angle between it and the central beam of the sonar, . Cells closer to the central beam of the sonar are more strongly updated as freespace than cells near the extrmeties of the beam. Ea 1 2 for 2 2 2 2.1.2 Surface Updates with the 2D gaussian sonar model A cell in the surface area of the beam, the shaded area in Fig 1, is updated in a similar manner. The update value PO(X,Y), the probability that a cell is occupied is calculated using the following formulae: PO(X,Y) = Or() * Oa() Or() is the probability that the cell is occupied based on its range from the sensor. The closer it is to the range reading received, the higher the probability that the cell is occupied. Or 1 R for R R 2 Oa() is the probability that the cell is occupied based on the difference in angle between the obstacle and the central beam of the sonar. The closer the cell is to the centre of the beam, the more likely it is that the cell is occupied. Oa 1 2 for 2 2 2 Fig. 1. The two dimensional gaussian sonar model 2.2 Multiple Target Sonar Model Fig 1 illustrates Moravec and Elfes’ 1985 model of the sonar beam. In this model, S is the sonar sensor P is the cell being updated is the mean sonar deviation error is the beam aperture, the angle at which the beam spreads from the sensor S is the distance from P to S The multiple target model, similar to the 2DG model, separates the sonar model into two sections. Therefore both PE(X,Y) and PO(X,Y) must be calculated. However in the Multiple Target Model, both freespace and surface readings are calculated using an identical formula. As with the 2DG sonar model, cells closer to the sonar sensor are more likely to be unoccupied and cells closer to the range reading are more likely to be occupied. Also, cells closer to the central beam of the sonar are updated more strongly than cells near the extremities of the beam, whether it be a freespace or surface update. On receipt of a sonar range reading, all cells in the beam are updated with the value P X , Y , using the formula: pr D Ci * pr D Ci 1 F * ri * F In the above formula, D is the range reading received by the sonar, and Ci states that the cell Ci is occupied. pr D Ci is the probability of receiving the range reading D given that the cell Ci is occupied. ri is the distance from the sonar to the cell being updated, and F is a small constant representing the probability that an obstacle could exist at point in the beam other than at the range measured, hence the name Multiple Target Model. pr D C i P X , Y ri ri 1 e D ri 2 2 ri 2 ri 2 1 2 e i 0 2 2 2 F is the attenuation of detection with distance, meaning that the farther away an obstacle is, the less likely it is to be detected. For the experiments, r 0.61 min 1,0.4r , giving a maximum sonar range of 2.5 metres. ri is the range variance, meaning that the farther the obstacle is from the sonar, the more the range measured will fluctuate. In experiments this was set to r .01 0.015r , which means that there is a fixed error of 1cm, plus 1.5% of the range. For experiments, this was set to 0.05. As in the 2DG sonar model, θ is the difference in angle between the cell and the central axis of the sonar beam, and ω is half the aperture of the beam. The above equation is a modified version of the normal distribution, 2 2 1 e x 2 , meaning that the 2 majority of the calculations required for this formula are already tabulated, making it quick and simple to calculate. The value pr D Ci is the probability that no range reading less than the one measured D would be received if the cell Ci were occupied. This is calculated by integrating the probability of all ranges less than D. p r D C i 1 Due to the fact that pr x C d dx pr D C is based on the normal D 0 i i distribution, the integration of it is tabulated, and can be stored for lookup, making it quick to calculate. 3. Mathematical Map Update Methods Three mathematical methods of integrating the value P X , Y from the sonar model with an occupancy grid are examined. The first is a slightly modified version of Moravec and Elfes [2] map update rules, from now on referred to as Simple Update Formula. The second is based upon the Bayesian update formula as described in [3], from now on referred to as Bayesian Update Formula. The third method is based on the use of log odds as proposed by Konolige in [4], referred to as Log Update Formula. 3.1 Simple Update Formula If the cell at the Cartesian coordinates (x, y) being updated is in the freespace area of the sonar beam, the value PE(x, y) is generated, which is integrated with the prior probability that the cell is unoccupied, Emp x, y , using the formula. Empx, y ' Empx, y PE x, y Empx, y * PE x, y If the cell is in the occupied area of the sonar beam, the value PO x, y is generated, which is integrated with the prior probability that the cell is occupied. Before that can happen however, the update values of all the cells in the occupied area of the sonar beam are normalised to one. This accounts for the fact that it is assumed that only a single cell on the arc of the beam caused the sound wave to reflect, therefore one cell should have its probability of occupancy set to one. However, as it is not possible to determine which cell caused the reflection, the probability of one is divided amongst all the cells in a weighted distribution. PO x, y PO x, y P x, y The second step integrates O PO x, y with the prior probability that the cell is occupied, Occ x, y to give a posterior probability that the cell is occupied, Occ x, y ' . Occ x, y ' Occ x, y PO x, y Occ x, y * PO x, y Finally, the value stored in the cell is decided based on which value is greater, Emp x, y or Occ x, y . 1 Empx, y if Empx, y Occ x, y Map x, y if Occ x, y Empx, y Occ x, y Finally, the freespace and surface values are combined to form the map using logarithms and addition. 3.2 Bayesian Update Formula This Bayesian Update Formula makes the assumption that the probability of a cell being occupied is one minus the probability of it being empty, and vice-versa, therefore Occ x, y 1 Emp x, y Map x, y . If the cell is in the freespace area of the sonar beam, the value PE x, y is generated. The first step is to translate PE x, y so that rather than representing the probability that a cell is unoccupied using number is the range [0..1], the range of numbers [0..0.5] is used, where zero means that the cell is definitely empty, and 0.5 means there is no information about the cell. PE x, y ' 1 PE x, y 2 PE x, y is then integrated with the prior value of the cell using the equation below, the Bayesian probabilistic update formula. Mapx, y PE x, y * Mapx, y PE x, y * Mapx, y 1 PE x, y * 1 Mapx, y A similar procedure is performed on an update on a cell in the occupied area of the beam. First PO x, y is translated from the range [0..1] to [0.5..1], where 0.5 represents a lack of knowledge about the cell, and 1 means the cell is definitely occupied. PO x, y ' 0.5 PO x, y 2 Finally the map is updated with the new value. PO x, y * Mapx, y Mapx, y PO x, y * Mapx, y 1 Po x, y * 1 Mapx, y 3.3 Log Update Method The Log Update Method uses a multiplication to integrate new values from the sonar model with a priori information, and then combines the probabilities of the cell being occupied and empty using logarithms and addition. Because of the use of multiplication, it is required for PO x, y to be translated to a number greater than one, and for PE x, y to be translated in a similar manner to a number less than one. This ensures that a surface reading causes the overall value to rise, while a freespace reading causes it to fall. PE x, y 1 PE x, y PO x, y 1 PO x, y PE x, y and PO x, y are then integrated with the prior information using multiplication. Empx, y ' Empx, y * PE x, y Occ x, y ' Occ x, y * PO x, y Mapx, y log 10 Empx, y * log 10 Occ x, y Unlike the previous two mathematical update methods, the Log Update Method does not map values into a range [0..1]. For this reason a cut off value must be set at which it can be said that a cell is definitely occupied, and another value at which the cell is definitely unoccupied. In the experimental results presented in section six, a range of [-2..+2] was used. 4. Benchmarking Techniques Used A suite of benchmarking techniques published in [6,7] have been applied to 126 maps generated with all sonar models and mathematical update methods. Both simulated and in real world environments were utilised. Each of the maps generated in the course of experimentation are compared against hand drawn ideal maps of the environment the robot traversed. A complete listing of all environments, benchmarks, and procedures followed can be obtained from [7]. All sonar models and mathematical methods were tested using identical sensor and motor data to facilitate an accurate comparison. The four tests are as follows: 1. Correlation. A higher percentage indicates a greater degree of similarity between the maps[8]. 2. Map Score. A technique proposed in [5] which calculates the difference between two maps. The lower the percentage difference, the greater the similarity between the two maps. 3. Map Score of Occupied Cells. Similar to the previous benchmark, but only tests those cells that are occupied, i.e. >0.5 in one or both of the maps being tested 4. Path Comparison For False Positive Paths. Calculates the percentage of paths in the map which would cause a robot to collide with an obstacle. The lower the percentage, the fewer paths would cause a collision, and therefore the better the map. 5. Experimental Results 5.1 Sonar Model Experimentation Results Correlation Map Score 2DG Model Multiple Target Model 53.11% Map Path Score Comparison Occupied False Cells Positives 16.50% 11.65% 64.20% 63.33% 13.50% 10.48% 42.70% 5.2 Mathematical Map Update Formulae Results Correlation Map Score Simple Update Bayesian Update Log Update 56.70% 55.34% 63.33% Map Path Score Comparison Occupied False Cells Positives 16.57% 11.11% 62.54% 16.44 12.19% % 13.50% 10.48% 65.85% 42.69% 6. Discussion When comparing the results of the two sonar models, the Multiple Target Model consistently performed better than the Two Dimensional Gaussian Model. The Correlation and Path Comparison benchmarks showed the most improvement. The Correlation benchmark shows the maps built more than a 10% increase in similarity with the ideal hand-drawn map. The Path Comparison benchmark shows the most dramatic improvement, with 22% fewer paths leading to collision with an obstacle. These results clearly demonstrate that the Multiple Target Model performs significantly better than the Two Dimensional Gaussian Model. This is largely due to the fact that it updates the map in much smaller increments than the 2DG model. Whereas the 2DG model can cause a cell to go from a freespace probability of zero to a probability of one with just two or three range readings, the Multiple Target Model updates the map much more gradually, usually requiring twenty or thirty freespace readings at a cell before its freespace probability converges to its maximum value. This more gradual update approach means the map is less affected by erroneous sonar readings, as a single noisy reading does not affect the map to a large degree, and can be corrected later by accurate range readings. The results for the mathematical map update methods are not quite as clear as those of the sonar models. The Simple Update and Bayesian Update methods perform more or less identically in the benchmarks, despite the fact that they use considerably different mathematics to update the map. While the Bayesian Update method is more mathematically robust than the Simple Update, using sound principles from probability theory, it offers no advantage over the Simple Update other than mathematical elegance. The Log Update, on the other hand, performs considerably better than both other update methods, with an 8% increase in Correlation, and a huge improvement of 20% in the Path Comparison benchmark. This result is highly dependant on the Min/Max threshold values chosen for the map however. If a higher maximum value is chosen then obstacles will not be recognised as quickly, whereas if a lower maximum value is used, then surface areas may be given over generous updates. The same holds true for the minimum threshold. It is possible that a Min/Max threshold that results in acceptable performance in one environment may not perform as well is another environment with different levels of noise. That being said however, if a method exists to estimate the noisiness of an environment, the Multiple Target Model can be tuned for that environment, making it a highly adaptable sonar model. 7. References 1. Crowley, J. L. 1985. "Navigation for an Intelligent 2. 3. 4. 5. 6. 7. 8. Mobile Robot." IEEE Journal of Robotics and Automation RA-1(1): 31-41 Moravec, H. P., Elfes, A. 1985. “High Resolution Maps from Wide Angle Sonar.” Proceedings of the 1985 IEEE International Conference on Robotics and Automation. Matthies, L., Elfes, A. 1988. “Integration of Sonar and Stereo Range Data Using a Grid-Based Representation.” Proceedings of the 1988 IEEE International Conference on Robotics and Automation, Philadelphia, Pennsylvania, USA. Konolige, K. 1997. "Improved Occupancy Grids for Map Building." Autonomous Robots 4(4): 351-367. Martin, M. C., Moravec, H.P. 1996. “Robot Evidence Grids.” Robotics Institute, Carnegie Mellon University, Pittsburgh, Pennsylvania. Collins, J. J., O’Sullivan, S., Mansfield, M., Eaton, M., Haskett, D. 2004. “Developing an extensible benchmarking framework for map building paradigms.”. In Proceedings Ninth International Symposium on Artificial Life and Robots, Oita, Japan, January 2004. O’Sullivan, S. 2003. An Empirical Evaluation Of Map Building Methodologies in Mobile Robotics Using The Feature Prediction Sonar Noise Filter And Metric Grid Map Benchmarking Suite. MSc Thesis, University of Limerick, Ireland. Baron, R. J. 1981. "Mechanisms of human facial recognition." International Journal of Man Machine Studies 15: 137-178.
