An Exceptionally Stable SERS-Active Substrate
advertisement
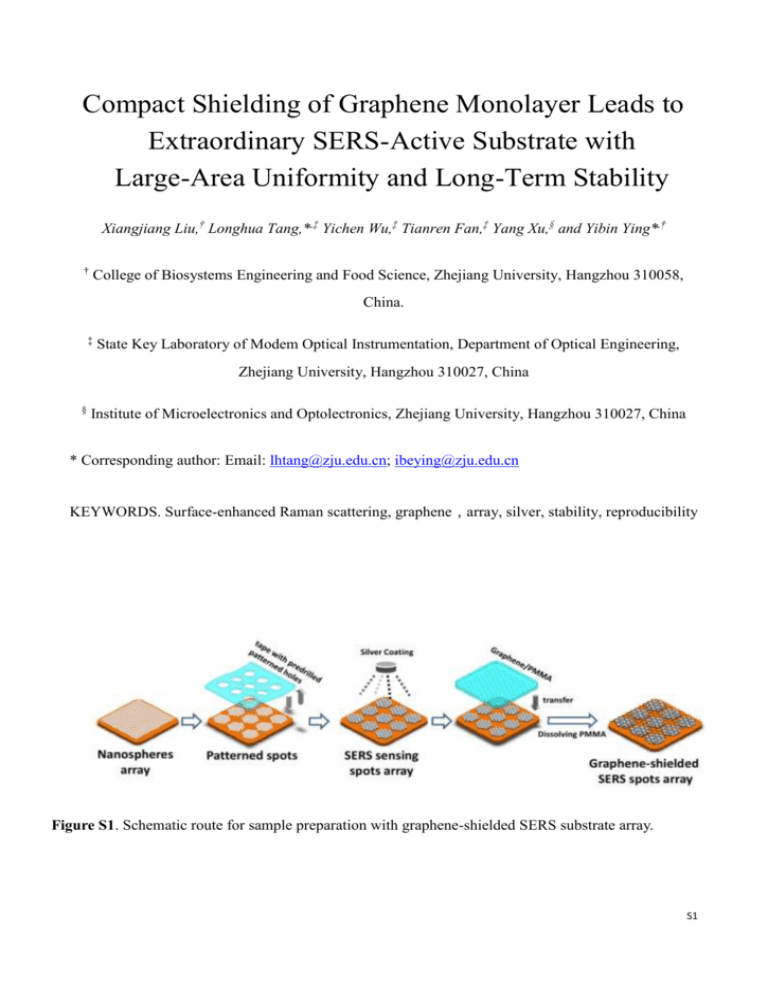
Compact Shielding of Graphene Monolayer Leads to Extraordinary SERS-Active Substrate with Large-Area Uniformity and Long-Term Stability Xiangjiang Liu,† Longhua Tang,*,‡ Yichen Wu,‡ Tianren Fan,‡ Yang Xu,§ and Yibin Ying*,† † College of Biosystems Engineering and Food Science, Zhejiang University, Hangzhou 310058, China. ‡ State Key Laboratory of Modem Optical Instrumentation, Department of Optical Engineering, Zhejiang University, Hangzhou 310027, China § Institute of Microelectronics and Optolectronics, Zhejiang University, Hangzhou 310027, China * Corresponding author: Email: lhtang@zju.edu.cn; ibeying@zju.edu.cn KEYWORDS. Surface-enhanced Raman scattering, graphene,array, silver, stability, reproducibility Figure S1. Schematic route for sample preparation with graphene-shielded SERS substrate array. S1 Figure S2. Typical images of graphene-shielded SERS substrates. S2 Figure S3. SEM images of the cross section of graphene-shielded SERS substrate array S3 Figure S4. Top view of the graphene-shielded SERS substrate. S4 Figure S5. SEM images of the large-scale graphene-shielded SERS substrate array Figure S6 Comparison of SERS intensities recorded on the graphene-covered and uncovered area. (50× objective, average of 16 spectra with 1s acquisition time). S5 Raman Intensity 10.0k 5.0k 0.0 200 400 600 800 1000 Diameter (nm)400 nm Adsorbence 500 nm 600 nm 700 nm 1000 nm Figure S7 Comparison of SERS intensities (1617 cm-1) of CV (top) and R6G (down) recorded on the graphene-shield substrates (50× objective, average of 16 spectra with 1s acquisition time) and 60 nm -1 gold nanoparticles (50× objective, average of 5 spectra with 10s acquisition time). 600 700 800 900 1000 1100 Wavelength (cm ) S6 Figure S8 Raman spectra on the SERS substrate containing 16 sensing spots. Figure S9 Image of a graphene-shielded SERS substrate after 8 months storage in ambient air since its preparation. The brown color in the uncovered area. indicates severe oxidation occurred. In contrast, in the graphene-covered area, it is still shining brightly. S7 Adsorbence 400 nm 500 nm 600 nm 700 nm 1000 nm 600 700 800 900 1000 1100 Wavelength (nm) Figure S10. Adsorption spectra of the graphene-shielded SERS substrates with different nanosphere diameter. Raman Intensity 10.0k 5.0k 0.0 200 400 600 800 Diameter (nm) 1000 Figure S11. The plot of the SERS intensities at 1167 cm-1 of CV versus the nanosphere diameter. The laser of 632 nm was used. S8
![[1] M. Fleischmann, P.J. Hendra, A.J. McQuillan, Chem. Phy. Lett. 26](http://s3.studylib.net/store/data/005884231_1-c0a3447ecba2eee2a6ded029e33997e8-300x300.png)
