Here - Spacey Ideas
advertisement
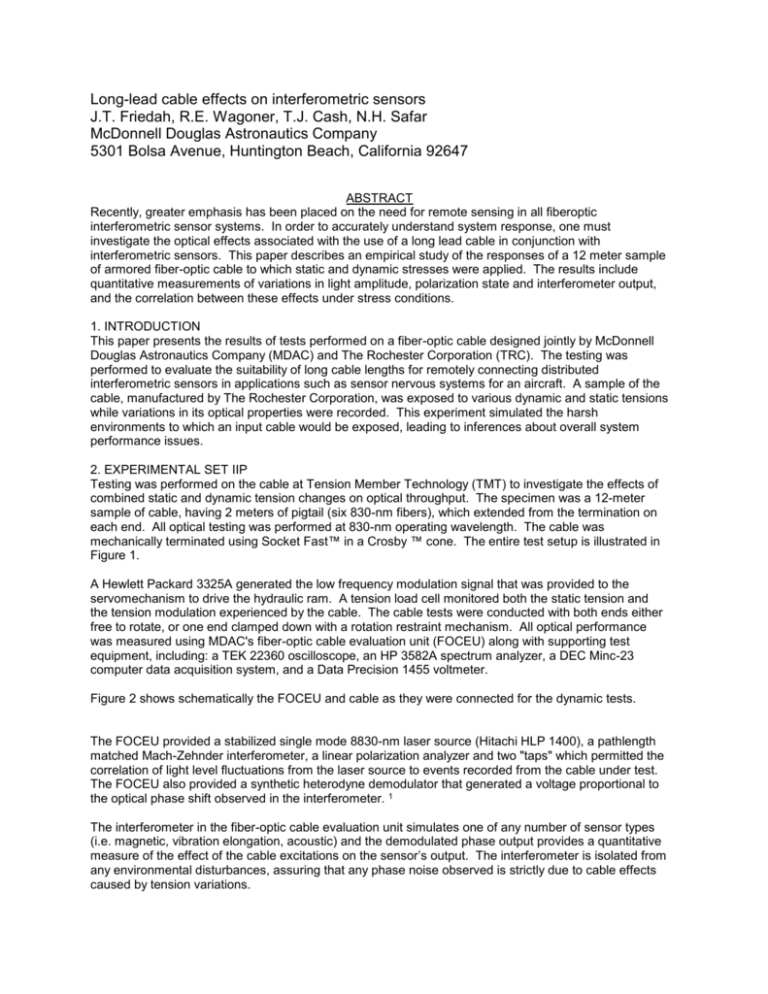
Long-lead cable effects on interferometric sensors J.T. Friedah, R.E. Wagoner, T.J. Cash, N.H. Safar McDonnell Douglas Astronautics Company 5301 Bolsa Avenue, Huntington Beach, California 92647 ABSTRACT Recently, greater emphasis has been placed on the need for remote sensing in all fiberoptic interferometric sensor systems. In order to accurately understand system response, one must investigate the optical effects associated with the use of a long lead cable in conjunction with interferometric sensors. This paper describes an empirical study of the responses of a 12 meter sample of armored fiber-optic cable to which static and dynamic stresses were applied. The results include quantitative measurements of variations in light amplitude, polarization state and interferometer output, and the correlation between these effects under stress conditions. 1. INTRODUCTION This paper presents the results of tests performed on a fiber-optic cable designed jointly by McDonnell Douglas Astronautics Company (MDAC) and The Rochester Corporation (TRC). The testing was performed to evaluate the suitability of long cable lengths for remotely connecting distributed interferometric sensors in applications such as sensor nervous systems for an aircraft. A sample of the cable, manufactured by The Rochester Corporation, was exposed to various dynamic and static tensions while variations in its optical properties were recorded. This experiment simulated the harsh environments to which an input cable would be exposed, leading to inferences about overall system performance issues. 2. EXPERIMENTAL SET IIP Testing was performed on the cable at Tension Member Technology (TMT) to investigate the effects of combined static and dynamic tension changes on optical throughput. The specimen was a 12-meter sample of cable, having 2 meters of pigtail (six 830-nm fibers), which extended from the termination on each end. All optical testing was performed at 830-nm operating wavelength. The cable was mechanically terminated using Socket Fast™ in a Crosby ™ cone. The entire test setup is illustrated in Figure 1. A Hewlett Packard 3325A generated the low frequency modulation signal that was provided to the servomechanism to drive the hydraulic ram. A tension load cell monitored both the static tension and the tension modulation experienced by the cable. The cable tests were conducted with both ends either free to rotate, or one end clamped down with a rotation restraint mechanism. All optical performance was measured using MDAC's fiber-optic cable evaluation unit (FOCEU) along with supporting test equipment, including: a TEK 22360 oscilloscope, an HP 3582A spectrum analyzer, a DEC Minc-23 computer data acquisition system, and a Data Precision 1455 voltmeter. Figure 2 shows schematically the FOCEU and cable as they were connected for the dynamic tests. The FOCEU provided a stabilized single mode 8830-nm laser source (Hitachi HLP 1400), a pathlength matched Mach-Zehnder interferometer, a linear polarization analyzer and two "taps" which permitted the correlation of light level fluctuations from the laser source to events recorded from the cable under test. The FOCEU also provided a synthetic heterodyne demodulator that generated a voltage proportional to the optical phase shift observed in the interferometer. 1 The interferometer in the fiber-optic cable evaluation unit simulates one of any number of sensor types (i.e. magnetic, vibration elongation, acoustic) and the demodulated phase output provides a quantitative measure of the effect of the cable excitations on the sensor’s output. The interferometer is isolated from any environmental disturbances, assuring that any phase noise observed is strictly due to cable effects caused by tension variations. To provide further diagnostic capability, the optical taps and polarization analyzer were used to help pinpoint the cause of the interferometer’s noise. The cable's input and output light amplitude (laser light/cable light) along with the two orthogonal linear polarization components of the cable output light (polarization state #1 and #2) were measured. The interferometer’s demodulated optical phase shift was also measured. This allowed for the correlation of light amplitude and polarization state change (static and dynamic) with the interferometer's output. 3. TESTING The cable was subjected to two days of dynamic testing while at the TMT facility. On the fast day, performance measurements were taken while the light was coupled through one fiber to the far end of the cable and back through a second fiber. The cable rotation mechanism was clamped during tests on the first day. On the second day, all six fibers were connected in a continuous circuit as shown in Figure 2, and the cable end was free to rotate. During both days of testing, the cable was subjected to various large static loads, while small amplitude sinusoidal dynamic tensions were applied. The FOCEU's test points (laser light, cable light, cable light's polarization state and demodulated phase output) were continuously monitored during all these operations. During gross static tension changes (e.g., 500 lbs to 10,000 lbs), the test points were monitored with a MINC-23 computer data acquisition system at a 1second sampling rate. Tension variations, along with amplitude changes, were monitored over fiveminute intervals, and the data plotted. During low frequency dynamic tests (1-20 lbs peak-to-peak @ 122 Hz), power spectrums and correlations between the spectrums were taken and recorded with a dual trace spectrum analyzer (HP 3582A). During the first day of testing, extensive baseline data were taken to observe any changes under the following conditions: 1) no cable (a short jumper replaced the cable at the FOCEU); 2) with the cable under no tension; and 3) with 5000 lbs static tension on the cable. While taking the data, there was no tension modulation of the cable. The results revealed that there was no significant noise floor increase at any measured test conditions. During large static variations (1,000 to 10,000 lbs), cable light amplitude variations were less than .14 dB. Polarization variations were as great as 6 dB over five minute intervals, but interferometer fringe visibility fell to no lower than 60% of maximum. The visibility was monitored at the detector output of the Mach-Zehnder interferometer with the Tektronix 22360 oscilloscope. Typical output variations are shown in Figure 3. After the baseline noise levels were established, a dynamic load at 22 Hz was applied. Data taken under these conditions (Figure 4) displayed a definite correlation between load cell power spectrum and the power spectrum of the various test points. The optical responses of the cable light, the polarization state, and the interferometer's phase output all showed high spectral coherence with the load cell's output. On the second day of testing, several sequences of tests were performed in an attempt to better quantify the observed effects and to determine their origin. Again, baseline information was taken, this time with the cable end unclamped. The results were very similar to the measurements taken on the previous day. At this point, all six fibers in the cable were spliced end to end as is shown in Figure 1, resulting in a 5.3 dB transmission loss through the cable. This configuration provided an effective test-cable length of 72 meters spliced to the fiber-optic cable evaluation unit. The first test sequence maintained the same dynamic load at 22 Hz while varying the static load from 1,000 to 3,000 to 5,000 lbs. This progression simulated the varying static loads that could occur under various system applications. To maintain a constant dynamic tension, the load cell's output was also monitored and kept constant. The phase response measured at the tension modulation frequency and its harmonics, for each of the three loads, showed no obvious correlation between static tension and cable response to dynamic tension variations, as is summarized in Table 1. As demonstrated during the second test sequence, this may have been due to a poor choice of tension modulation frequency, which coincided, with a harmonic of the cable natural frequency at 5,000 lbs tension. A high spectral coherence was observed between the interferometer's phase output and both the cable light and the polarization state outputs. This indicates that both responses may result from a dynamic stress-induced polarization state modulation. The next comparative data were taken while varying the frequency of the dynamic load with a constant static load. The amplitude of the phase response varied as much as 16 dB as the applied frequency was swept from 13 to 22 Hz at constant modulation amplitude, as measured at the load cell's output. The data can also be found in Table 1. The peak response was at 22 Hz and appeared to be due to a transverse cable resonance. This effect was verified when the cable was physically strummed (@ 8,000 lbs static load) and the cable fundamental natural frequency (5.5 Hz) and several of its harmonics were excited and observed in power spectra of interferometer and polarization outputs (Figure 5). This data agreed with the calculated cable resonance frequency. The 22 Hz resonant response was large enough to obscure both the polarization effect observed previously and any changing response with excitation frequency. To investigate continuity between optical response and the amplitude of the tension modulation, the load cell's dynamic amplitude at 22 Hz was lowered by 10 dB increments. As can be seen from Table 1, the change in signal levels (cable light, Polarization state, demodulated interferometric phase) with tension modulation was not linear. Only the phase output showed a general decreasing trend with decreasing dynamic tension. To further investigate this unexpected result, the cable light signal amplitude was monitored while varying the polarization state (with fixed values of static and dynamic tension) by simply rotating a loop of fiber at the input. The cable light amplitude was found to vary by 20 dB (Figure 6), indicating that the response to changes in dynamic tension is quite dependent on the static polarization state of the light in the cable. The demodulated phase output showed a similar response, although not as dramatically as the cable light amplitude. 4. SUMMARY While it is difficult, at best, to project a system response based on laboratory simulation, this simple experiment provides important Preliminary information. Using these results and defining environmental noise sources, such as ship vibration or stresses induced in embedded fibers in aircraft. it is possible to make worst case predictions about sensor noise. Known environmental noise spectra can be used in conjunction with the information gathered in Table 1 to predict the nature of the cable-induced interferometer phase noise spectrum. Thus in an actual application, it may be possible to identify cableinduced response by comparing vibration or cable tension spectra with sensor output spectra. This prediction is useful in defining system architectures and in determining system designs. The cause of the cable-induced phase noise is clearly dependent on the state of input polarization to the cable. The most likely cause of this effect is modulation of the fiber birefringence either over the length of the cable or at high stress points at the end terminations. This birefringence modulation causes polarization state modulation and hence noise in the interferometer.2 A loose tube cable design or a non-embedded input lead are two alternatives which can decrease cable compression and non symmetric radial stress, thus reducing induced phase noise. 5. REFERENCES 1. A. Dandridge, A. B. Tveten, and T. G. Giallorenzi, "Homodyne demodulation scheme for fiber-optic sensors using phase generated carrier," IEEE Journal of Quantum Electronics, Vol. QE18, No. 10, October 1982. 2. I. P. Kaminow, "Polarization in optical fibers," IEEE Journal of Quantum Electronics, Vol. QE-17, No. 1, January 1981.
