Key Maths 82
advertisement
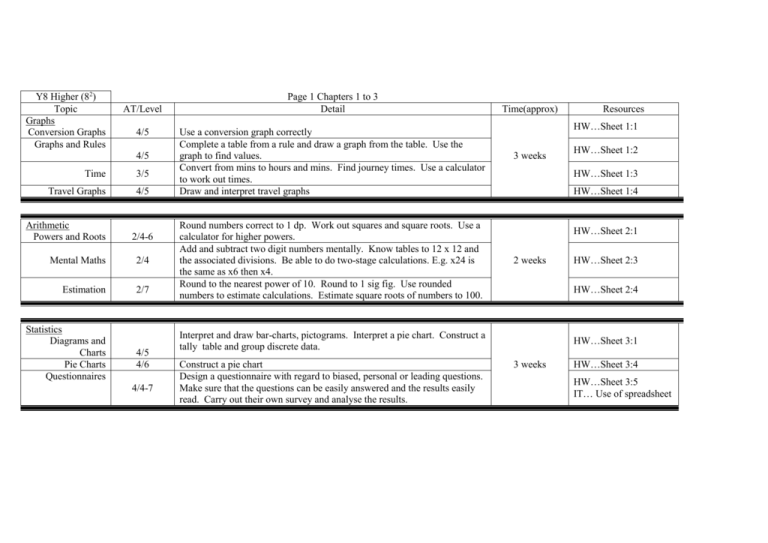
Y8 Higher (82) Topic Graphs Conversion Graphs Graphs and Rules AT/Level 4/5 4/5 Time 3/5 Travel Graphs 4/5 Arithmetic Powers and Roots 2/4-6 Mental Maths 2/4 Estimation 2/7 Statistics Diagrams and Charts Pie Charts Questionnaires 4/5 4/6 4/4-7 Page 1 Chapters 1 to 3 Detail Use a conversion graph correctly Complete a table from a rule and draw a graph from the table. Use the graph to find values. Convert from mins to hours and mins. Find journey times. Use a calculator to work out times. Draw and interpret travel graphs Round numbers correct to 1 dp. Work out squares and square roots. Use a calculator for higher powers. Add and subtract two digit numbers mentally. Know tables to 12 x 12 and the associated divisions. Be able to do two-stage calculations. E.g. x24 is the same as x6 then x4. Round to the nearest power of 10. Round to 1 sig fig. Use rounded numbers to estimate calculations. Estimate square roots of numbers to 100. Time(approx) HW…Sheet 1:1 3 weeks HW…Sheet 1:2 HW…Sheet 1:3 HW…Sheet 1:4 HW…Sheet 2:1 2 weeks HW…Sheet 2:3 HW…Sheet 2:4 Interpret and draw bar-charts, pictograms. Interpret a pie chart. Construct a tally table and group discrete data. Construct a pie chart Design a questionnaire with regard to biased, personal or leading questions. Make sure that the questions can be easily answered and the results easily read. Carry out their own survey and analyse the results. Resources HW…Sheet 3:1 3 weeks HW…Sheet 3:4 HW…Sheet 3:5 IT… Use of spreadsheet Y8 Higher (82) Topic Algebra Number Patterns Inverses Substitution Transformations Reflection Translation AT/Level 2/5 2/6 2/7 3/4 3/4 Rotation 3/4 Enlargement 3/6 Negative Numbers Revision Rules Using negative numbers Page 2 Chapters 4 to 6 Detail Find a rule then a formula for a number pattern. Use a formula. Find the inverse to a formula. Solve simple liear equations Use index notation and substitute numbers into formulas Reflect a shape in a given horizontal , vertical or diagonal mirror line. Reflect 3-D shapes. Translate a shape a given number of squares vertically and horizontally. Rotate a shape through ½ or a ¼ turn clockwise or anticlockwise. Create a shape with a given order of rotational symmetry. Enlarge a shape from a given centre of enlargement by a given scale factor. 2/5 Use an extended number line. Solve practical problems. Use < and > signs correctly with negative numbers. Enter negative numbers on a calculator. Be able to add, subtract, multiply and divide directed numbers 2/<8 Substitute directed numbers into formulas and expressions 2/5 Time(approx) 2 weeks Resources HW…Sheet 4:1 HW…Sheet 4:2 HW…Sheet 4:3 HW…Sheet 5:1 HW…Sheet 5:2 2 weeks HW…Sheet 5:3 HW…Sheet 5:4 HW…Sheet 6:1 2 weeks HW…Sheet 6:2 HW…Sheets 6:3,4 Y8 Higher (82) Topic Angles AT/Level Revision 3/5 Parallel Lines 3/6 Polygons 3/6 Bearings 3/6 Probability Revision Add to 1 4/5 4/6 Notation 4/5 Sample Spaces 4/6 Percentages and Fractions Simple percentages Calculators Fractions 2/5 2/6 2/6 Page 3 Chapters 7 to 9 Detail Acute, obtuse and reflex angles. Estimation and drawing of acute and obtuse angles. Calculation of angles at a point and on a straight line. Finding opposite angles. Calculating angles in triangles including isosceles and equilateral. Find angles made by an intercept on parallel lines. Know the terms alternate, corresponding and interior when referring to angles. Calculate angles in parallelograms, trapeziums and rhombuses. Identify common polygons and calculate the sum of their interior angles. Decide whether shapes will tessellate. Use three figure bearing. Give the bearing of A from B given the bearing of B from A. Show probabilities on a scale. Express probabilities as a fraction. Calculate the expected number of outcomes. Know that the probabilities of mutually exclusive events add to 1 Use the notation P(A). Calculate the probability of an event not happening i.e. P(not A) = 1 P(a). List all possible events in a table Calculate 10% mentally and use it to calculate 20%, 30%, etc. Calculate 50% and use it to calculate 25%. Use 10% to calculate 5% Use 10% and 5% to calculate 15%, 35%, etc. Use a calculator to find percentages of amounts. Change fractions and decimals to percentages. Find a fraction of an amount. Use the fraction key on a calculator. Convert between fractions, decimals and percentages. Time(approx) Resources HW…Sheet 7:1 3 weeks HW…Sheet 7:2 HW…Sheet 7:3 HW…Sheet 7:4 HW…Sheet 8:1 2 weeks HW…Sheet 8:2 HW…Sheet 8:3 HW…Sheet 8:4 HW…Sheet 9:1 2 weeks HW…Sheet 9:2 HW…Sheet9:3,4. Y8 Higher (82) Topic Graphs Straight Lines AT/Level 2/5 Equations 2/6 Ratio Metric System Ratio Proportion 3/5 2/<6 Maps and Scales 2/6 3/6 Area Revision Trapezium Enlargement 3/6 3/6 3/6 Page 4 Chapters 10 to Detail Recognise and name vertical and horizontal lines on a grid. Find points of intersection of lines on the grid. Draw graphs of the kind, y = mx, y = x + c. Recognise which equation gives the steepest line. Recognise where the line y = x + c crosses the y axis. Recognise parallel lines from their equations. Find the equation of a given straight line and a line parallel to it. Convert between metric units and from common imperial units to metric. Write in figures a ratio given in words. Alter amounts in given proportions. Simplify ratios and divide an amount into a given ratio. Convert scales into the form 1 : n. Convert map distances into actual distances and vice versa. Find the perimeter of a shape. Find the area of a rectangle, triangle and parallelogram. Estimate the area of an irregular shape by square counting/ Find the area of a trapezium and compound shapes involving trapeziums. Appreciate that if a shape is enlarged by a factor x its area is enlarged by a factor x2. Also use the reverse of this. Time(approx) Resources HW…Sheet 8:1 2 weeks HW…Sheets 8:3, 4 HW…Sheet 11:1 HW…Sheet 11:2 2 weeks HW…Sheet11:3 HW…Sheet 11:4 HW…Sheets 12:1 2 weeks HW…Sheets 12:2 HW…Sheets 12:3 Y8 Higher (82) Topic Statistics Averages and Range Groupings Frequency Polygons Volume Introduction Prisms Inequalities Trial and Improvement Inequalities Linear inequalities AT/Level 4/5 4/6 4/6 Page 5 Chapters 13 to 16 Detail Work out the mean, mode and median of simple discrete data. Work out the range of discrete data. Group both discrete and continuous data. Draw bar charts of grouped data. Decide on suitable group sizes. Read data from a frequency polygon. Compare two distributions using frequency polygons. Draw a frequency polygon from discrete and grouped data. 3/4 3/7 Order containers in order of volume. Estimate the volume of containers. Find the number of boxes in a stack. Find the volume of a simple cuboid. Use the formula volume = area of cross-section x length 2/6 Solve an equation by trial and improvement. 2/<7 2/7 Graphs Lines More Lines 2/6 2/6 Problems 2/7 Time(approx) Use a number line, list integer solutions to inequalities. Solve double inequalities using a number line, listing integer solutions. Solve simple linear inequalities by using inverses. Generate coordinates from a table and vice versa. Draw straight lines from the tables and find points of intersection. Find coordinates on lines with equations like x + y = c and ax + by = c Generate a pair of equations from given information. Use straight lines to solve simultaneous equations. Resources HW…Sheets 13:1 2 weeks HW…Sheets 13:2 HW…Sheets 13:3 1 week HW…Sheets 14:1,2 HW…Sheets 14:3,4 HW…Sheet 15:1 2 weeks HW…Sheet 15:2 HW…Sheet 15:4 HW…Sheet 16:1 2 weeks HW…Sheet 16:3 HW…Sheet 16:4
