Lab 7. Foraging Behavior Lab – Questions
advertisement
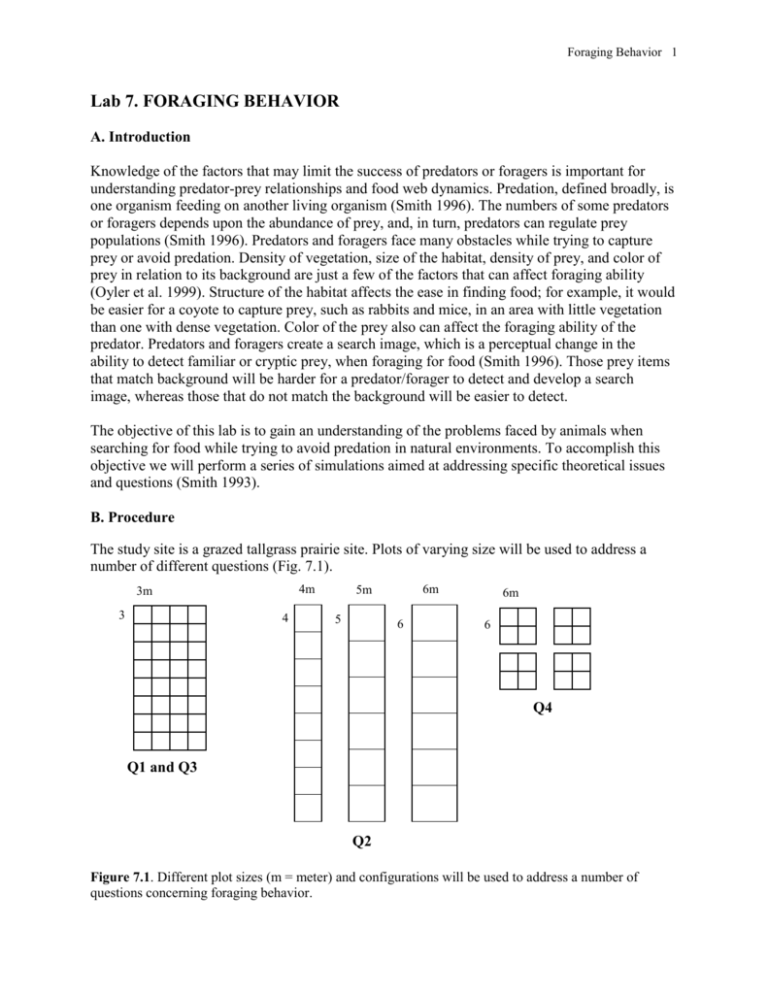
Foraging Behavior 1 Lab 7. FORAGING BEHAVIOR A. Introduction Knowledge of the factors that may limit the success of predators or foragers is important for understanding predator-prey relationships and food web dynamics. Predation, defined broadly, is one organism feeding on another living organism (Smith 1996). The numbers of some predators or foragers depends upon the abundance of prey, and, in turn, predators can regulate prey populations (Smith 1996). Predators and foragers face many obstacles while trying to capture prey or avoid predation. Density of vegetation, size of the habitat, density of prey, and color of prey in relation to its background are just a few of the factors that can affect foraging ability (Oyler et al. 1999). Structure of the habitat affects the ease in finding food; for example, it would be easier for a coyote to capture prey, such as rabbits and mice, in an area with little vegetation than one with dense vegetation. Color of the prey also can affect the foraging ability of the predator. Predators and foragers create a search image, which is a perceptual change in the ability to detect familiar or cryptic prey, when foraging for food (Smith 1996). Those prey items that match background will be harder for a predator/forager to detect and develop a search image, whereas those that do not match the background will be easier to detect. The objective of this lab is to gain an understanding of the problems faced by animals when searching for food while trying to avoid predation in natural environments. To accomplish this objective we will perform a series of simulations aimed at addressing specific theoretical issues and questions (Smith 1993). B. Procedure The study site is a grazed tallgrass prairie site. Plots of varying size will be used to address a number of different questions (Fig. 7.1). 4m 3m 3 4 6m 5m 5 6 6m 6 Q4 Q1 and Q3 Q2 Figure 7.1. Different plot sizes (m = meter) and configurations will be used to address a number of questions concerning foraging behavior. Foraging Behavior 2 For each activity, students will pair up into groups of two. One individual will need to record the following information while the other forages: 1) 2) 3) 4) Name of forager Plot size Initial number of macaroni or other food source and the question being addressed Day and time of each foraging event C. Questions (see Smith 1993) The following questions will address the effects of different factors, such as size of the habitat, density of prey, and coloration of prey, on the ability of a predator to successfully forage. Listed below each question is the activity designed to address the question and specific hypothesis to be tested. 1. How can both predator and prey populations survive a prolonged period like winter when the prey population is not being renewed? Activity: a) work in groups of two (1 forager, 1 timer) b) go to a 3 x 3 square c) 100 macaroni pieces (scattered evenly throughout the square by the timer) d) 5 pieces = daily food requirement needed during the winter (= 12 days) e) timer records the length of time needed by the forager to collect daily requirement of food and return to the starting point f) foraging continues until the forager starves (can no longer collect 5 pieces within 60 seconds), even if this exceeds the length of winter (12 days) Once the forager dies, the pair moves to a new 3 x 3 m square and the roles are reversed. Note: Food caching is not allowed, the forager must return to the start point (the ‘nest’) as soon as the daily food requirement is found. 2. How does density of food affect the foraging rate and longevity of a predator? Activity: a) 12-18 students will forage individually in squares ranging is size from 4 x 4 m to 6 x 6 m b) 100 macaroni pieces (scattered evenly throughout the square by the timer c) foraging time should increase and survival time decrease as density of food decreases Hypothesis: As the density of food decreases the foraging rate and longevity of a predator will decrease. Foraging Behavior 3 3. Does matching the background color of the vegetation give prey an advantage in escaping predation? Activity: a) 4-6 students will forage on 50 pieces of yellow macaroni and 50 pieces of red macaroni in a 3x3 m square b) number of each type of food found each day is recorded along with the number of seconds it takes to find five pieces of any kind Hypothesis: Red macaroni will be more readily found than yellow macaroni. 4. Does the exclusive use of an area impart an advantage to an individual that would otherwise be compensate for the time and energy needed to defend that territory? Activity: a) 2 groups of 4 students and their timers b) a group of 4 students forage together in a 6x6 m square in which one of the timers scatters 400 pieces of macaroni (density and number of food items per student is same as for question 1) c) one timer starts all 4 foragers together for each day and each of the 4 timers determines how long it takes his/her forager to find 5 macaroni pieces d) when a forager finds 5 pieces, he/she takes them back to the nest and then can return to harass the remaining students until all have found their food References Oyler, M., J. Rivera, M. Roffol, D.J. Gibson, B.A. Middleton, and M. Mathis. 1999. The macaroni lab: a directed inquiry project on predator-prey relationships. The American Biology Teacher 61:39-41. Smith, C.C. 1993. Testing issues of foraging and flocking behavior. In J.M. Beiswenger (ed.), Experiments to Teach Ecology, Ecological Society of America, Washington D.C., pp. 111-135. Smith, R.L. 1996. Ecology and Field Biology. 5th ed. Harper Collins College Publishers, Inc. Foraging Behavior 4 Appendix 1. STATISTICAL ANALYSIS 2x2 (Two-way) Contingency Table Objective: To determine if two variables are related (or dependent). Ho: The two variables are independent (i.e., unrelated) Ha: The two variables are dependent (i.e., related) The test statistic for independence of the two variables is the 2, or the chi-square test of independence: 2 = [(nij - Ê(nij))2 / Ê(nij)] where nij = the observed number of measurements falling the cell for the ith row and jth column Ê(nij) = the expected number of measurements falling in the cell for the ith row and jth column when the two variables are independent Ê(nij) = (ni.*n.j)/ n where ni. = total for row i n.j = total for column j Reject Ho if 2 exceeds the tabulated value of chi-square (2 = 3.84) for = 0.05 and df = (r-1)(c-1), where r = number of rows in the table and c = number of columns in the table. Here is an example calculation: Suppose that we want to determine if the number of different colored prey captured is related to timing of foraging (first half of foraging or second half). Table 6.1 shows the two-way contingency table for testing this hypothesis. Table 7.1. Two-way contingency table for determining if number of prey captured is related to timing of foraging. Expected values (Ê's) are in parentheses. Timing First half (1-10 days) Second half (11-20 days) Total (n.j) Color of Prey Captured Red Yellow 163 137 (149.5) (150.5) 125 153 (138.5) (139.5) 288 290 Total (ni.) 300 278 n.. = 578 Foraging Behavior 5 The following are the calculations used to determine the expected values, the chi-square statistic, and test for independence: Expected values: For row 1, column 1: For row 1, column 2: For row 2, column 1: For row 2, column 2: Ê(n11) = (300*288)/578 = 149.5 Ê(n12) = (300*290)/578 = 150.5 Ê(n21) = (278*288)/578 = 138.5 Ê(n22) = (278*290)/578 = 139.5 Chi-square statistic: 2 = [((163-149.5)2/149.5) + ((137-150.5)2/150.5) + ((125-138.5)2/138.5) + ((153 -139.5)2/139.5)] = 1.22 + 1.21 + 1.32 + 1.31 = 5.06 Significance test: 2 = 3.84 with df = (2-1)(2-1) = 1 and = 0.05 If 2 > 2, then the Ho can be rejected. Since 5.06 > 3.84, then there is sufficient evidence to reject Ho. Therefore, the color of prey and timing of foraging are not independent. Color of prey and the number of prey captured for each of these colors appears to dependent upon timing of foraging. During the first half of foraging a greater number of red prey were captured than was expected. Foraging Behavior 6 Lab 7. Foraging Behavior Lab – Questions Due April 8, 2003 Your assignment for this lab is to interpret the data collected from our field simulations of foraging behavior. The data you collect will be compiled and averaged by the instructor and presented to you via the course web site. Make line graphs when appropriate and use them to answer the following questions. For these line graphs, plot day on the x-axis (independent variable) vs. foraging time or survivorship on the y-axis (dependent variable). 1. a) (5 points) Does matching color of prey to the background vegetation reduce foraging ability of predators? Explain. Compare foraging times and survivorship for the 100 yellow macaroni to that with 50 red and 50 yellow macaroni. b) (5 points) Were the conspicuous prey (red macaroni) found more readily than the yellow macaroni? Use a 2 x 2 contingency table to test whether the red macaroni was found more often during the first half of the foraging exercise than during the second half. Provide support for your answer by interpreting the test statistic. Red Yellow Total First half (1-8 days) Second half (9-16 days) Total 2. (6 points) How did the density of food affect the foraging rate and longevity of a predator? Plot and compare foraging times in 3 x 3 m plots to that in 4 x 4, 5 x 5, and 6 x 6 m plots. Explain your answer. 3. (4 points) Does exclusive use of an area (without competition) give an advantage to an individual that would otherwise allocate time and energy towards defending a territory? Plot and compare foraging times and survivorship for 100 macaroni without competition to foraging times for 100 macaroni with competition. Provide support for your answer.
