Session 8: Running Group-Comparison of CFA using AMOS
advertisement
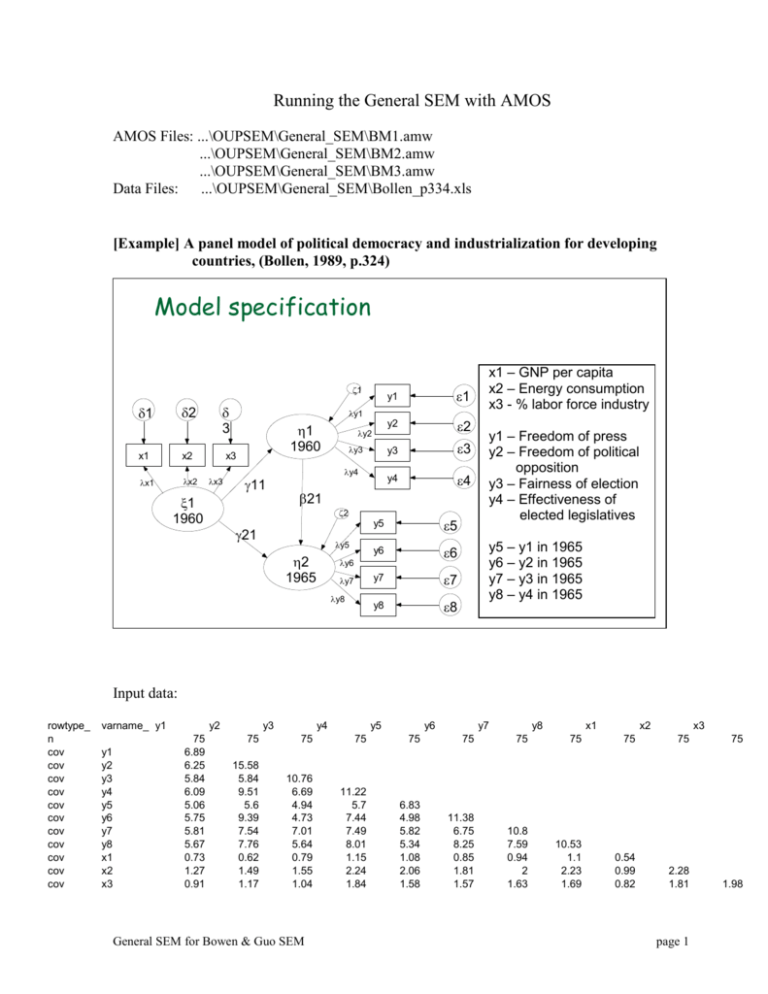
Running the General SEM with AMOS AMOS Files: ...\OUPSEM\General_SEM\BM1.amw ...\OUPSEM\General_SEM\BM2.amw ...\OUPSEM\General_SEM\BM3.amw Data Files: ...\OUPSEM\General_SEM\Bollen_p334.xls [Example] A panel model of political democracy and industrialization for developing countries, (Bollen, 1989, p.324) Model specification 1 2 1 x1 x2 x1 x2 3 1 1960 1 y2 2 y3 3 y4 4 y1 1 1960 x3 x3 y1 11 y2 y3 y4 21 2 21 y5 2 1965 y5 5 y6 6 y7 7 y8 8 y6 y7 y8 x1 – GNP per capita x2 – Energy consumption x3 - % labor force industry y1 – Freedom of press y2 – Freedom of political opposition y3 – Fairness of election y4 – Effectiveness of elected legislatives y5 – y1 in 1965 y6 – y2 in 1965 y7 – y3 in 1965 y8 – y4 in 1965 Input data: rowtype_ n cov cov cov cov cov cov cov cov cov cov cov varname_ y1 y1 y2 y3 y4 y5 y6 y7 y8 x1 x2 x3 y2 75 6.89 6.25 5.84 6.09 5.06 5.75 5.81 5.67 0.73 1.27 0.91 y3 y4 y5 y6 y7 y8 x1 x2 x3 75 75 75 75 75 75 75 75 75 75 15.58 5.84 9.51 5.6 9.39 7.54 7.76 0.62 1.49 1.17 10.76 6.69 4.94 4.73 7.01 5.64 0.79 1.55 1.04 11.22 5.7 7.44 7.49 8.01 1.15 2.24 1.84 6.83 4.98 5.82 5.34 1.08 2.06 1.58 11.38 6.75 8.25 0.85 1.81 1.57 10.8 7.59 0.94 2 1.63 10.53 1.1 2.23 1.69 0.54 0.99 0.82 2.28 1.81 1.98 General SEM for Bowen & Guo SEM page 1 [Run 1] The objective of this run is to find out whether the specified model is a good measurement model. The measurement model is a congeneric CFA with associative relations among all factors. 1.95 1 y1 6.48 1.00 1 y2 4.84 1 y3 1.04 1.30 1 y4 e3 2.88 e4 2.40 4.48 1 y5 4.341.00 1.28 1.26 y6 y7 .77 1.31 1 e63.50 1 e7 2.93 1 y8 1 1.00 2.19 1.82 x1 x2 e8 .09 .45 Indust60 e5 4.34 Demo65 .65 e2 5.33 1.35 Demo60 e1 1 d1.10 d2 .47 1 x3 d3 BM1: CFA 1 of Bollen Mode(1989) p.324 Chi-square = 70.575 (41 df), p=.003 RMSEA=.099 GFI=.856, CFI=.955 Results show that the model does not fit data well. From here, Dr. Bollen made three important decisions to improve the model: (1) he allowed measurement errors for the same indicator variable at the two time points to be correlated – the rationale of doing this is the need to specify autoregressive errors explicitly; (2) he allowed the path coefficient linking the endogenous factor to an indicator variable to have same value at both time points (i.e., path of DEMO60 to y2 = path of DEMO65 to y6, and so on); and (3) he allowed the following pair of indicator variables to have a correlational error at both times: “freedom of group opposition” and “effectiveness of the legislative body”, that is, correlational errors of y2 and y4, y6 and y8. General SEM for Bowen & Guo SEM page 2 Comment: these are very important and smart respecifications that combine both statistical and substantive rationales. Discussion: you could adopt other method to respecify the model, such as using MIs, correlating additional measurement errors, etc. But none of these is as clever as those adopted by Dr. Bollen! [Run2] Results show that the model has an excellent fit to data. 1.87 1 y1 7.58 1.00 1 y2 4.84 1.19 Demo60 y3 1 y4 e3 1.44 3.22 e4 .58 2.18 2.32 4.59 1 y5 4.641.00 1.19 1.18 .83 1.25 .45 y6 y7 1 2.19 1.82 1 e7 e8 .09 x1 1 d1.11 d2 .47 1 x3 1.37 3.30 1 y8 x2 .36 e63.55 1 1.00 Indust60 .71 e5 4.97 Demo65 .65 e2 4.95 1 1.18 1.25 e1 d3 BM2: CFA 2 of Bollen Mode(1989) p.324 - Respedification Chi-square = 38.767 (38 df), p=.435 RMSEA=.017 GFI=.921, CFI=.999 General SEM for Bowen & Guo SEM page 3 [Run 3] We now run the general SEM as a path analysis, that is, change the curve lines into one-arrow causal lines, while keeping all measurement features the same as Run 2. .58 .71 2.18 .36 1.44 e1 y1 y4 y3 y2 1.00 1 1 1 1.19 1.18 z1 Demo60 e6 1 1 1.25 3.88 1 1.47 1.19 Demo65 .87 1 1 y8 y7 y6 1.00 e8 e7 e5 y5 3.30 3.55 4.97 2.32 e4 e3 e2 1 3.22 4.95 7.58 1.87 1.37 1.18 1.25 z2 1 .17 .60 .45 Indust60 1.00 x1 1 .09 d1 2.19 x2 1 .11 d2 1.82 x3 1 .47 d3 BM3: Structural Regression Model (A Panel Model) Bollen (1989) p.324 Chi-square = 38.767 (38 df), p=.435 RMSEA=.017 GFI=.921, CFI=.999 General SEM for Bowen & Guo SEM page 4 Findings and Interpretations R-squares: Estimate Demo60 .198 Demo65 .964 x1 .837 x2 x3 y8 y7 y6 y5 y4 y3 y2 y1 .952 .759 .687 .643 .570 .666 .702 .575 .476 .722 Interpretation 19.8% of the variation in democracy in 1960 is explained by the level of industrialization in 1960. 96.4% of the variation in democracy in 1965 is explained by both the level of industrialization in 1960 and the level of democracy in 1960. 83.7% of the variation in the observed variable x1 is determined by the latent variable. Very high. This suggests a good measurement model. This is true for all other indicator variables. Relatively low. Standardized coefficients: The standardized path coefficient of INDUST60 on DEMO65 is estimated as .186, meaning that every one-standard-deviation-unit increase in industrialization of 1960 increases 0.186 standarddeviation-unit of democracy in 1965. Direct, indirect, and total effects: Indirect effect of INDUST60 on DEMO65 via DEMO60 = (1.468)*(.866) = 1.271 S.E. (indirect effect) = .866 2.396 2 1.4682.0752 .3602 Critical Ratio (indirect effect) = 1.271/.3602 = 3.5286 Effect Direct Indirect via mediator Total General SEM for Bowen & Guo SEM .601 (32.1% of total) S.E. .228 Use * to indicate significance at .05 level * 1.271 (67.9% of total) .3602 * Estimated Path Coefficient (Unstandardized) 1.872 page 5
